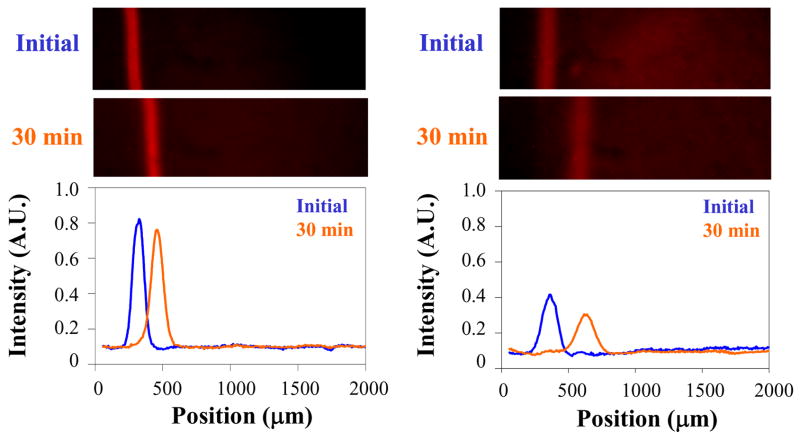
Figure 3.
Images of Texas Red DHPE migrating through a 75 mol% POPC/25 mol% cholesterol bilayer after TLC purification. Left: Texas Red from the large mol. fraction isomer after TLC purification, initially (top) and after 30 min of 100 V applied potential (middle). Right: the corresponding images for the other isomer. The plots below the images show the associated linescans, initially and after 30 minutes, corrected for vignetting.

