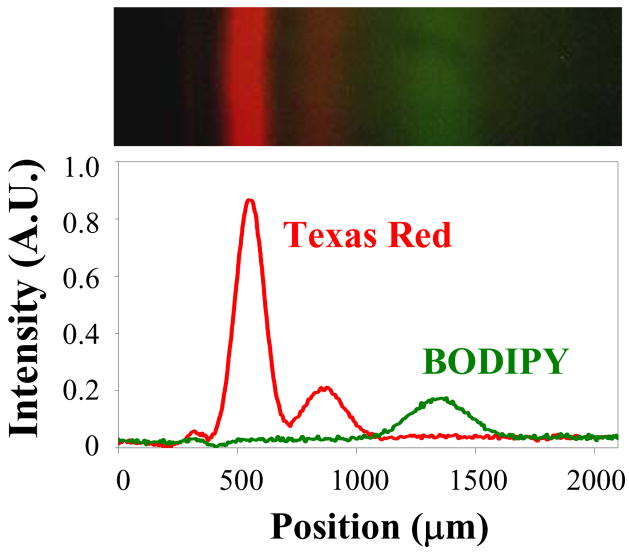
Figure 4.
Top: Composite image of the separation of TR DHPE and BODIPY DHPE in a POPC bilayer containing 25 mol% cholesterol after 35 minutes of applying a 100 V potential. Bottom: corresponding linescan of the image, corrected for vignetting. The small peak at ~300μm represents an approximately 2% immobile fraction of total dye-labeled molecules. The areas of the large and small peaks of Texas Red are ~ 75% to 25%, which is slightly different than the areas in Figure 1 and probably represents a small amount of batch-to-batch variability in the dye formulation of the manufacturer.

