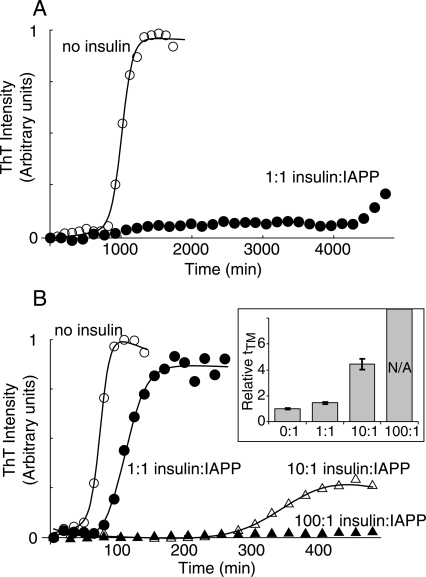
Figure 2.
Inhibition of IAPP fiber formation by insulin, monitored by Thioflavin T (ThT) fluorescence. (A) Reaction kinetics of 10 μM IAPP with (filled) and without (open) 10 μM insulin at pH 6.0 with 10 mM Zn++ in the absence of liposomes. (B) Fiber formation of 10 μM IAPP at pH 7.4 with 1.3 mM DOPG. Data in A and B are representative of experiments performed in triplicate, in parallel with controls lacking IAPP (Supplemental Fig. 2). The transition midpoint time (tTM) was extracted from sigmoid fits (solid lines). (Inset) Mean values of tTM normalized to zero insulin, for reactions performed in triplicate. No transition was observed for 100:1 insulin:IAPP. Error bars are ±1 SD.

