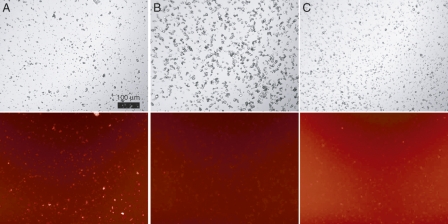
Figure 3.
Rhodamine-IAPP binding to insulin crystals. Microcrystals were prepared of either (A,C) human insulin or (B) hen egg white lysozyme, and washed into CZ6 buffer. To these were added (A,B) 2 μM rhodamine-IAPP or (C) 2 μM rhodamine-BSA. Crystals are clearly visible in phase contrast mode (top). Protein binding is evidenced by bright crystal surfaces when viewed with a Texas Red fluorescence filter (bottom). Note that rhodamine-BSA contains multiple fluorophores per molecule thus, the background fluorescence appears brighter. Scale bar (100 μm) applies to all panels.

