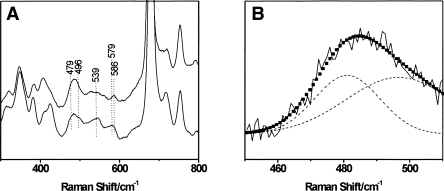
Figure 4.
Comparitive resonance Raman spectra of the CO complexes of ferrous F. hepatica and P. epiclitum hemoglobin. The laser-excitation wavelength was 413.1 nm at 1 mW power. (A) Low-frequency spectrum (300–800 cm−1) of Fa. he. HbF2CO (top) and Pa.ep. HbF2CO (bottom). (B) Detail of the determined RR spectrum of Fa.he. HbF2CO (solid black line), the deconvolution into two separate Fe-CO stretching contributions (dashed black line), and the fitted peak (■).

