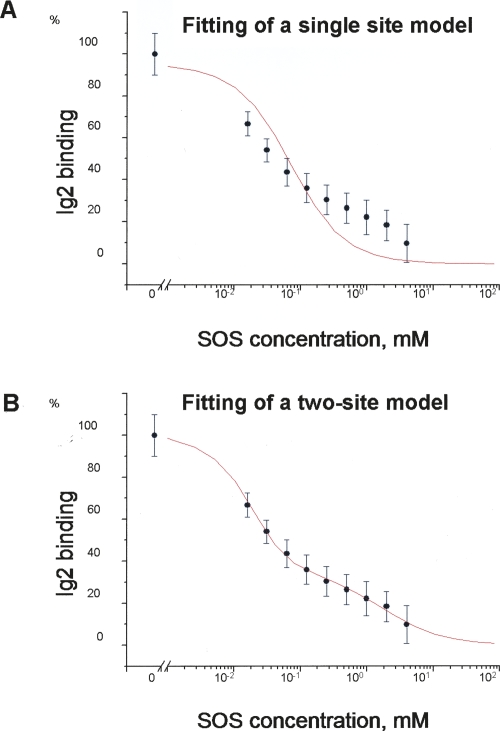
Figure 5.
Competition isotherm (by SOS) of the FGFR Ig2 module binding to the NCAM. The isotherm shows the maximum binding level of Ig2 at 20 μM concentration versus SOS concentration. The data were fitted with a single site model in A and a two-site model in B. The data are shown as averages of six replicates, with error bars corresponding to standard deviations.

