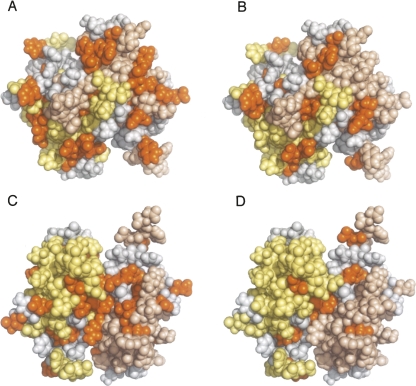
Figure 6.
Mapping of chemical shift changes on calcium-bound human S100B upon binding to TET-L348A and NRD. Monomers within S100B dimer are shown in pale yellow and wheat color. A and B are equivalent views showing the dimer interface, and C and D are a 180° rotation around the X-axis of A and B, respectively. Residues for which perturbations of chemical shifts are >0.04 ppm in all the experiments shown in Figure 5B upon binding of NRD (A,C) or TET-L348A (B,D) are shown in orange. Residues that we were not able to unambiguously reassign are shown in gray.

