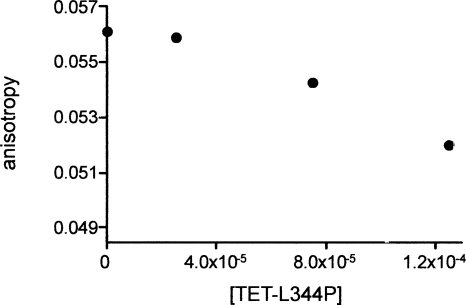
Figure 7.
Fluorescence anisotropy measurements of S100B in the presence of fluo-NRD and TET-L344P peptides. Data are the mean of duplicate measurements. Fluo-NRD and S100B concentrations were kept constant at 2 μM and 15 μM, respectively. The bottom value of the Y-axis 0.04845 is the mean anisotropy of two independent samples containing exclusively 2 μM NRD as a reference.

