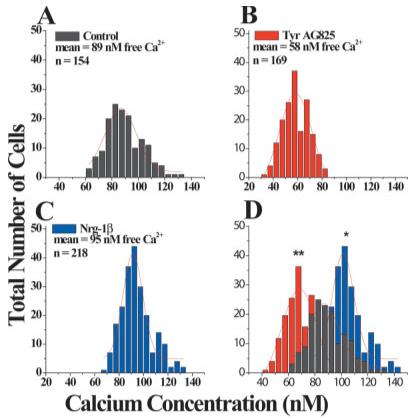
Fig. 6.

Fura-2 imaging demonstrates that intracellular free Ca2+ is decreased in TyrAG825- and increased in Nrg-1β-treated cells. A: D54 cells treated with vehicle for 12 hr have mean resting free intra-cellular calcium concentrations of 89 ± 1.1 nM (n = 154). B: D54 cells treated overnight with TyrAG825 (50 μM) had a mean resting calcium concentration of 58 ± 0.8 nM (n = 169). C: D54 cells treated overnight with Nrg-1β (80 nM) had a mean intracellular free calcium concentration of 95 ± 0.9 nM (n = 218). D: Overlay of the bar graphs in A—C demonstrate the shift in mean intracellular calcium concentrations in the three different treatment conditions. *P < 0.05, **P < 0.001.
