
Fig. 7.
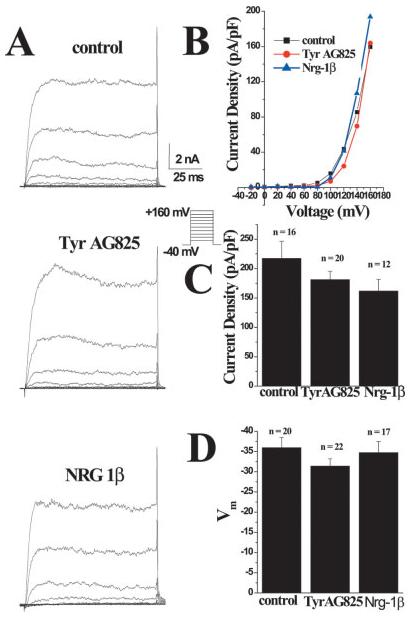
Whole-cell recording parameters are unchanged in TyrAG825- and Nrg-β1-treated cells. A: Representative examples of whole-cell currents evoked from stepping the membrane from 0 to 100 mV from a holding potential of –40 mV under each treatment condition. B: I-V plot of peak current in each treatment condition. C: Plot of the mean current density (pA/pF) of control, Nrg-1β and TyrAG825-treated cells. D: Plot of the mean resting membrane potential (mV) of cells in each treatment condition. Note that the more hyperpolarized potentials are toward the top of the graph.