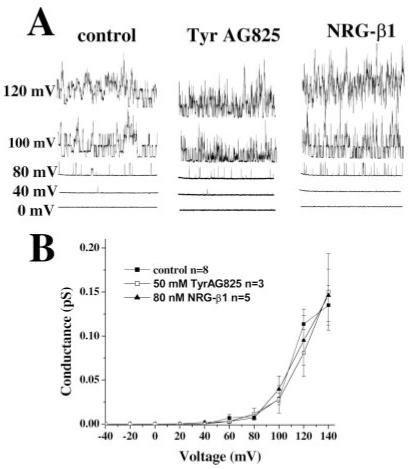
Fig. 8.

The shift in BK activation threshold in treated cells is lost when [Ca2+]i is controlled. A: Current responses at five different voltages from representative inside-out patch recordings of control, TyrAG825-treated (50 μM), and Nrg-1β-treated (80 nM) cells in the absence of extracellular Ca2+. B: Plot of the mean conductance (pS) from several cells under each condition as a function of voltage (mV). Data points are the mean ± SE, and n = the number of cells under each condition.
