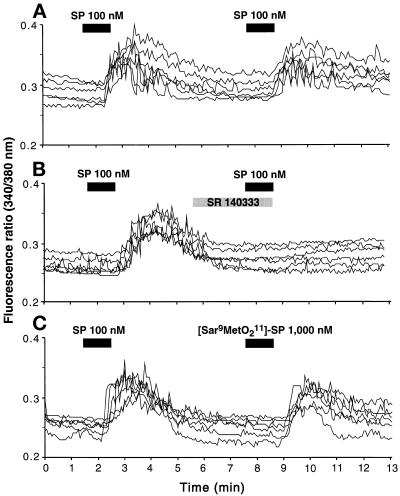
Figure 3.
SP-induced Ca2+ mobilization in myenteric neurons. (A) Neurons were exposed to SP for 1 min, washed, and then exposed again to SP 5 min later. (B) Neurons were exposed to SP for 1 min, washed, and then exposed again to SP 5 min later in the presence of the NK1-R antagonist SR 140333. (C) Neurons were exposed to SP for 1 min, washed, and then exposed again to the NK1-R–selective agonist [Sar9 MetO211]-SP 5 min later. Each trace shows the 340:380 nm fluorescence ratio, which is proportional to [Ca2+]i, for a single neuron, and observations were repeated on at least three different coverslips.

