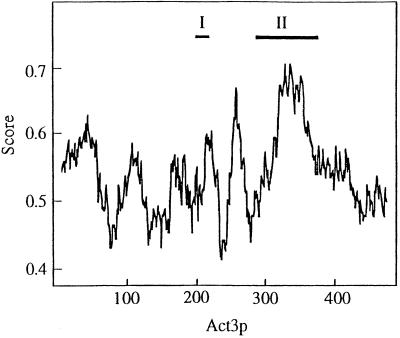
Figure 1.
Accessibility plot of Act3p. The accessible surface area of Act3p was calculated according to the method of Janin (1979) using a computation program available on the Internet (http://expasy.hcuge.ch/cgi-bin/protascale; window size 21). Numbers under the horizontal axis represent those of the amino acids of Act3p. Scores beside the vertical axis show the probability to be accessible on the surface of the molecule for each region of Act3p. Roman numerals (I and II) represent the positions of the insertions I and II of Act3p, respectively.

