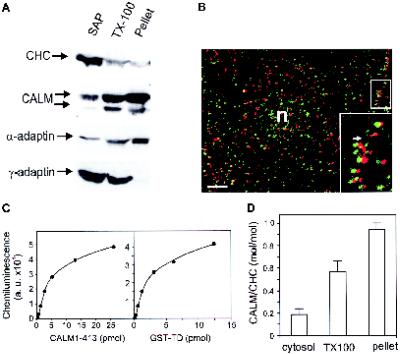
Figure 4.
The quantitative analysis of CALM and CHC in cellular fractions. (A) The saponin (SAP) and TX100-soluble (TX-100) and -insoluble (pellet) fractions were obtained from HeLa cells as described in MATERIALS AND METHODS and resolved on SDS-PAGE. CHC, CALM, α-adaptin, and γ-adaptin were detected by Western blotting with antibodies TD.1, Ab20, AC.1, and 100/3, respectively. (B) HeLa cells grown on coverslips were permeabilized with saponin and TX100 as described in MATERIALS AND METHODS, fixed with methanol/acetone, and incubated with Ab20 and AP.6 followed by secondary anti-rabbit and anti-mouse IgG conjugated with fluorescein or CY3, respectively. The serial optical sections were acquired through the CY3 (red) and FITC (green) channels and deconvoluted. The fluorescein (CALM) and CY3 (AP-2) images representing individual optical sections (thickness of 0.2 μm) were merged, and the red image was shifted to the right by 3 pixels (0.2 μm) relative to the green image to allow better visualization of the colocalization. Inset (bottom right), high magnification of a group of coated pits (area indicated by white rectangular box) is shown; the arrow indicates the direction of the shift. The position of the nucleus is indicated (n). Bar, 5 μm. (C) Various amounts of CALM–1–413 and GST–TD were electrophoresed and blotted with, correspondingly, Ab20 and TD.1 simultaneously with the blotting of CALM and clathrin in cellular fractions obtained as described in A. Exemplary curves of the dependence of the chemiluminescence signals on the amount of proteins are presented. Typically, the intensity of these signals measured by densitometry (see MATERIALS AND METHODS) displayed linear dependence within the range of 1–5 pmol of the proteins. Arbitrary units (a.u.) represent the optical density units. (D) Various aliquots of HeLa cellular fractions were immunoblotted as described in A, and the chemiluminescence signals that fit within the linear range of the detection in the same experiments were used to calculate the mole/mole ratio of CALM and CHC. The data are averaged from four experiments similar to that presented in A. Error bars represent SDs.

