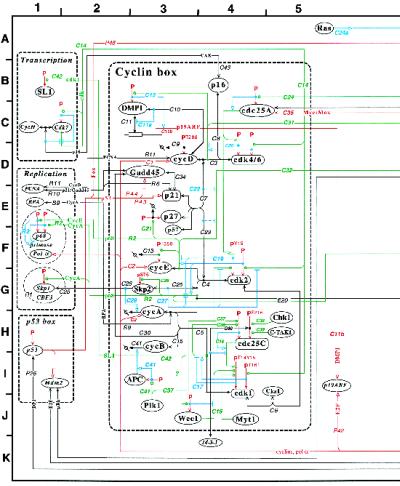
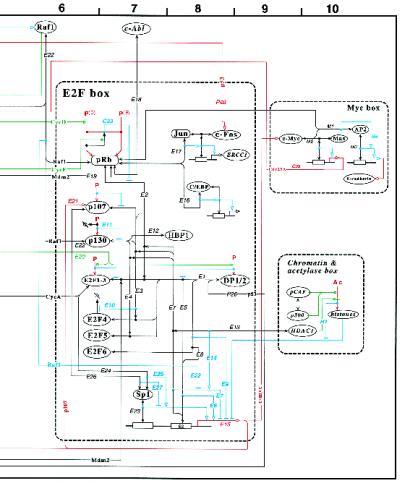
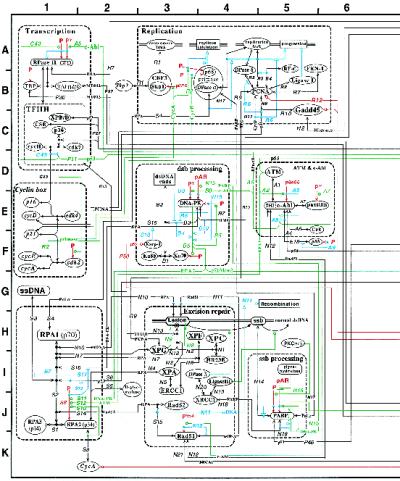
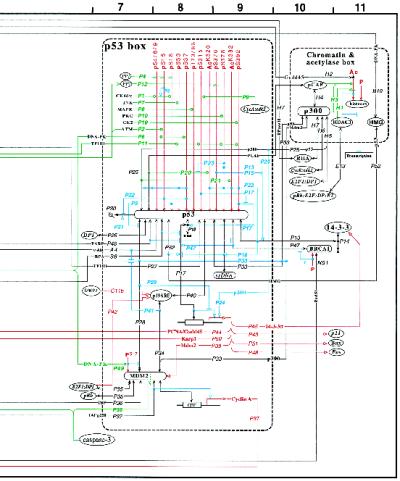
Figure 6.
Molecular interaction map of the regulatory network that controls the mammalian cell cycle and DNA repair systems. The map is presented in two parts: A focuses on the E2F-pRb and Cyclin:Cdk subsystems and functionally related interactions; B focuses on the p53-Mdm2 and DNA repair subsystem and functionally related interactions. Some duplication between the two parts of the maps was unavoidable but was noted by using italicized species or subsystem names to indicate that their interactions are shown in greater detail on the other part of the map. Although interaction symbols are fully defined by the conventions listed in Figure 1, the following colors were used to enhance readability: black, binding interactions and stoichiometric conversions; red, covalent modifications and gene expression; green, enzyme actions; blue, stimulations and inhibitions. See Appendix for annotations.


