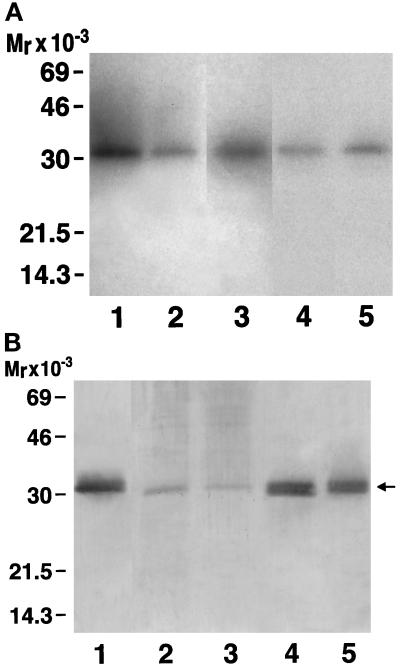
Figure 3.
(A) Ligand blot of IGFBPs in the ECM. The cultures that were secreting the various forms of IGFBP-5 shown in Figure 2 were used. ECM extracts were prepared from confluent cultures as described previously and analyzed by SDS-PAGE followed by Western ligand blotting. The amount of ECM that was loaded in each lane was determined by the relative abundance of IGFBP-5 that was produced by each cell line shown in Figure 2A. Lane 1, wild-type IGFBP-5; lane 2, R201A/K202A/R207A; lane 3, R201A/K202A/R206N/R208A; lane 4, K211N/R214A/K217A/R218A; lane 5, mock transfected culture. The 31-kDa band that is shown represents intact IGFBP-5. No fragment is detected because IGFBP-5 within ECM is protected from proteolysis (Jones et al., 1993a). The experiment was repeated three times with similar results. (B) Immunoblot of IGFBP-5 in the ECM. The cultures that were analyzed in A were also analyzed by immunoblotting as described in MATERIALS AND METHODS. Lane 1, wild-type IGFBP-5; lane 2, K211N/R214A/K217A/R218A; lane 3, R201A/K202A/R207A; lane 4, mock transfected; lane 5, R201A/K202A/R206N/R208A. The arrow denotes the position of IGFBP-5.

