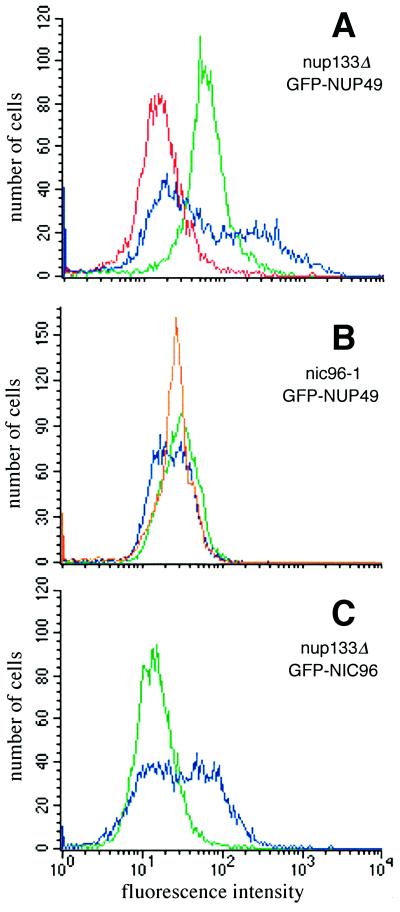
Figure 1.
NPC mutants expressing GFP-Nup49p have distinct fluorescence properties compared with wt cells expressing GFP-Nup49p. Flow cytometry analysis was performed on cells grown to logarithmic phase in SD lacking leucine (488 nm ex, 530 nm em). wt strains expressing GFP-Nup49p (SWY894, green profiles in panels A and B) have a fluorescence emission level nearly five times as great as the endogenous fluorescence of cells not expressing GFP (SWY1601, red profile in panel A). (A) nup133Δ cells expressing GFP-Nup49p (SWY1667, blue) display a bimodal distribution reflecting two populations of GFP-labeled cells with different fluorescence levels. (B) nic96–1 cells expressing GFP-Nup49p (SWY1860) show a broad, left-shifted peak after growth at 23°C (blue) and a sharp symmetrical peak after growth for 5 h at 37°C (orange). (C) nup133Δ cells expressing GFP-Nic96p (SWY1824, blue) have a distinct profile compared with wt cells expressing GFP-Nic96p (green).

