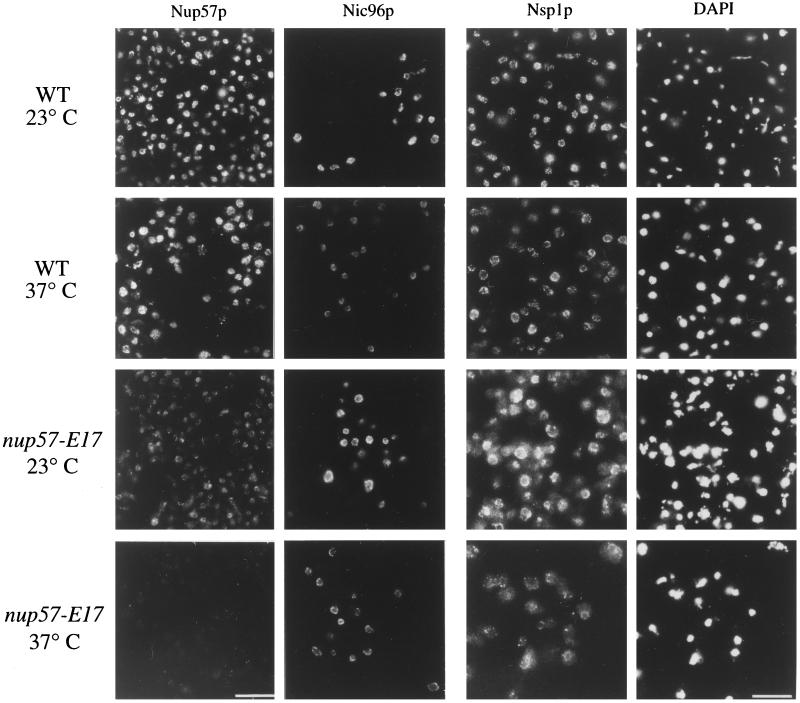
Figure 9.
Microscopic analysis of NPC/NE association of nup57pE17, Nic96p, and Nsp1p in nup57-E17 cells reveals decreased staining for nup57pE17 and Nsp1p. Indirect immunofluorescence microscopy was performed on wt (SWY519) and nup57-E17 (SWY1587) strains using antibodies recognizing the C-terminal region of Nup57p (left column). Direct fluorescence microscopy was performed on wt (SWY1695, SWY1728) and nup57-E17 (SWY1722, SWY1736) strains expressing GFP-tagged Nic96p or Nsp1p, respectively. Cells were shifted to growth at 37°C for 4 h. Within each column, images were photographed and printed for identical times for direct comparison of fluorescence intensities. The DAPI photographs in the right column correspond to the fields of Nsp1p cells. Bars, 10 μm, with Nup57p and Nic96p images at identical magnifications.

