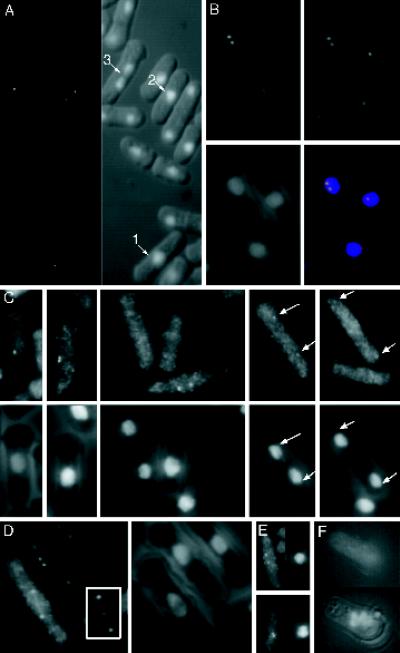
Figure 2.
Plo1 localizes to the SPBs and mitotic spindle in a cell cycle-specific manner. (A) GFP autofluorescence in formalin-fixed cells of the strain IH1314 grown at 25°C in EMM2 supplemented with leucine to fully induce the nmt41 promoter. Two dots were seen in mitotic cells up to early anaphase B (cell 1, 2, 3). (B) Immunofluorescence staining of these cells with anti-GFP antibodies (B, top left panel) and Sad1 (B, top right panel) antibodies. Sad1 (top right, and red in bottom right) and Plo1 (top left, and green in bottom right) colocalized to give a yellow signal in the mitotic cell in the merged image (bottom right panel). DAPI staining (blue, bottom right) along with phase contrast (B, bottom left panel) shows chromatin localization with respect to the outline of the cell. (C) Plo1 immunofluorescence staining of the wild-type strain IH365 using HN184 antisera (top panels) and the same cells stained with DAPI and coincidentally viewed with phase contrast (bottom panels) to reveal the location of chromatin relative to the cell periphery. The panels are arranged from left to right to show successive stages as mitosis progresses. The earliest localization of Plo1 was to a single SPB. It then localized as two bright and distinct dots as the SPBs separated, and as anaphase progressed the localization to the SPBs continued, but the intensity was greatly reduced (arrows in the final panels). The images in Figure 4C were processed to the same extent, to highlight the variations in Plo1 intensity rather than to give the best qualitative image. (D) HN184 stained short spindles of wild-type cells until the start of anaphase, when very briefly it was at its brightest after the chromatin had separated. After this the staining could no longer be seen. (E) Microtubules of IH365 cells were depolymerized by incubation in an ice bath for 20 min. Left-hand panels show HN184 staining; right-hand panels show DAPI phase-contrast images of the same cells. The top cell was stained before cooling, and the bottom cell was stained after cooling. Plo1 SPB association was unaffected by microtubule depolymerization. (F) HN184 staining of germinating spores from which plo1+ has been deleted. The top panel shows no HN184 signal, whereas the DAPI phase-contrast image in the bottom panel shows the condensed chromatin, which is characteristic of mitotically arrested cells.

