
Figure 1.
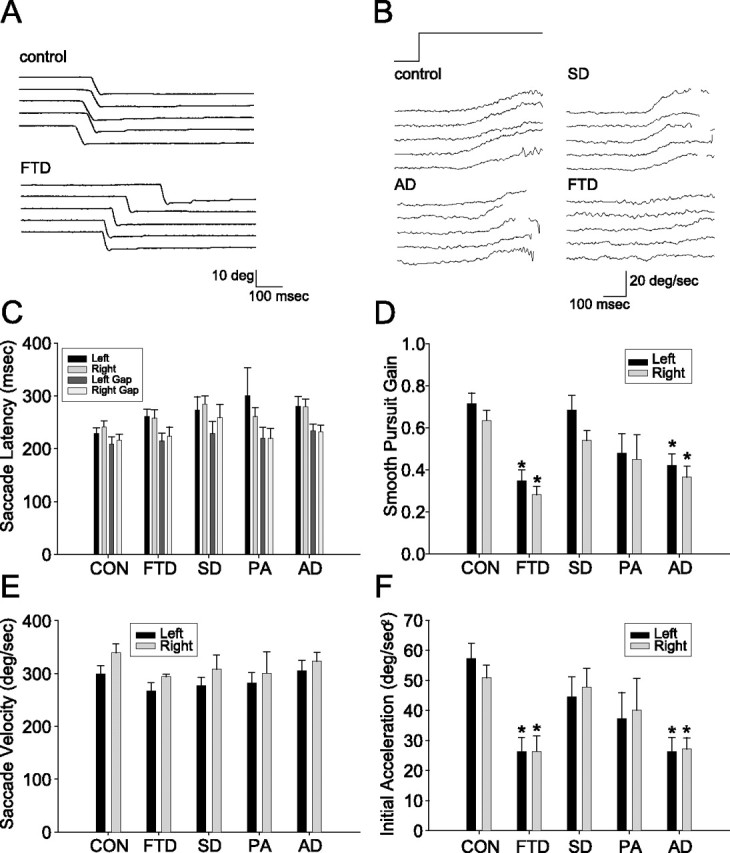
Visually guided saccades and smooth pursuit eye movements in FTLD and AD. A, Eye position traces showing examples of five successive downward saccades in a control subject and an FTD subject. B, Eye velocity traces showing examples of five consecutive pursuit responses from individual subjects from the control, AD, SD, and FTD groups. Target motion was 20 deg/s to the right. The rapid deflections of eye velocity associated with catch-up saccades have been removed. C–F, Bar graphs summarizing the oculomotor behavior of controls (CON) and all patient groups. In all graphs, black and gray bars show responses to rightward and leftward targets. Error bars show SDs across subject within each group. Asterisks indicate effects that were statistically significant relative to controls (p < 0.05, ANOVA, Tukey post hoc). C, Horizontal saccade latencies under overlap conditions and when a 200 ms gap is introduced between fixation offset and saccade onset. D, Mean gain of smooth pursuit eye movements. E, Mean velocity of horizontal saccades. F, Initial eye acceleration of horizontal smooth pursuit eye movements.