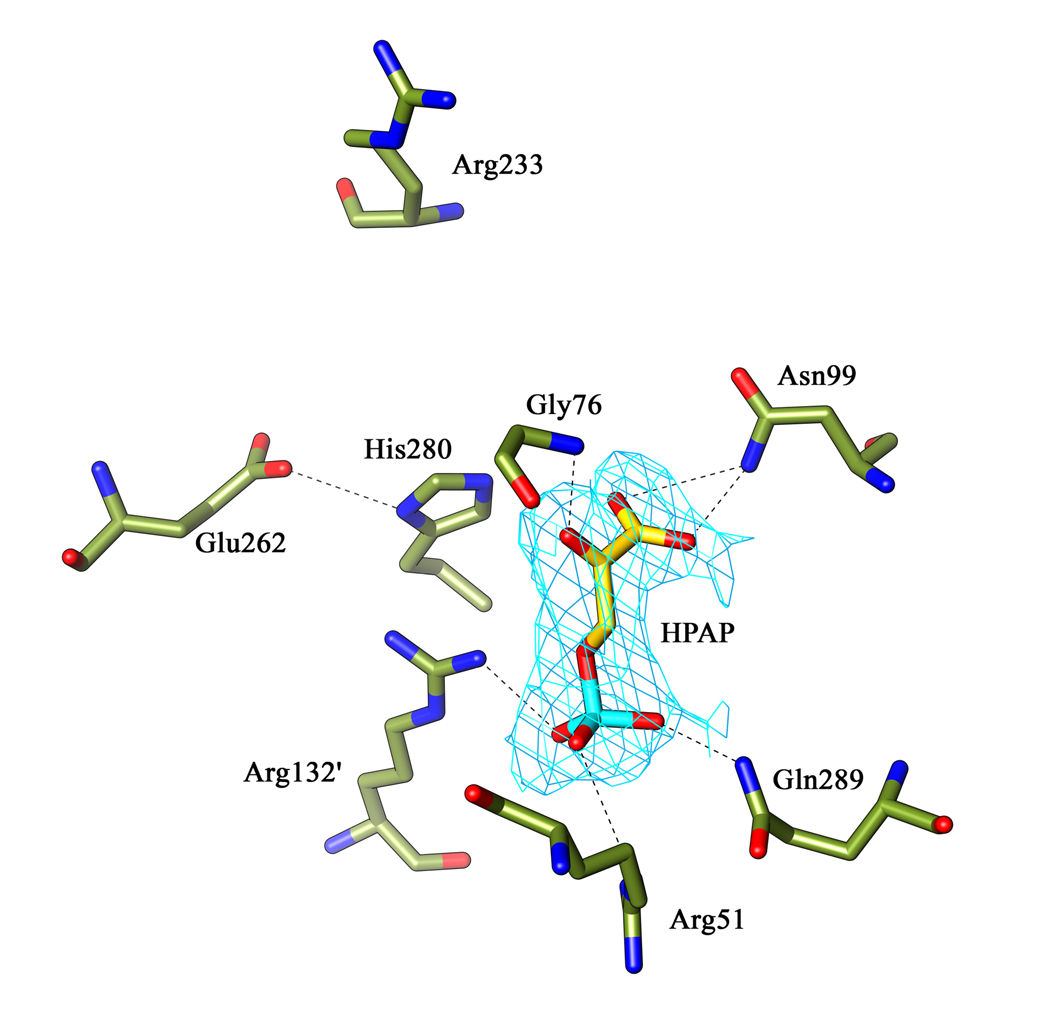
Figure 2. Interaction of HPAP at the M. tb PGDH active site.
This figure shows all the residues involved in the HPAP interaction in chain B of the substrate bound M.tb PGDH structure. Also shown are the catalytic dyad His280:Glu262 and Arg233 in relation to HPAP at the active site. The Shake &wARP unbiased 2Fo−Fc electron density map for HPAP (light blue) is contoured at 1σ level. HPAP is shown within the electron density. Oxygen atoms are shown in red, nitrogen atoms in blue, and phosphorus atoms in cyan.

