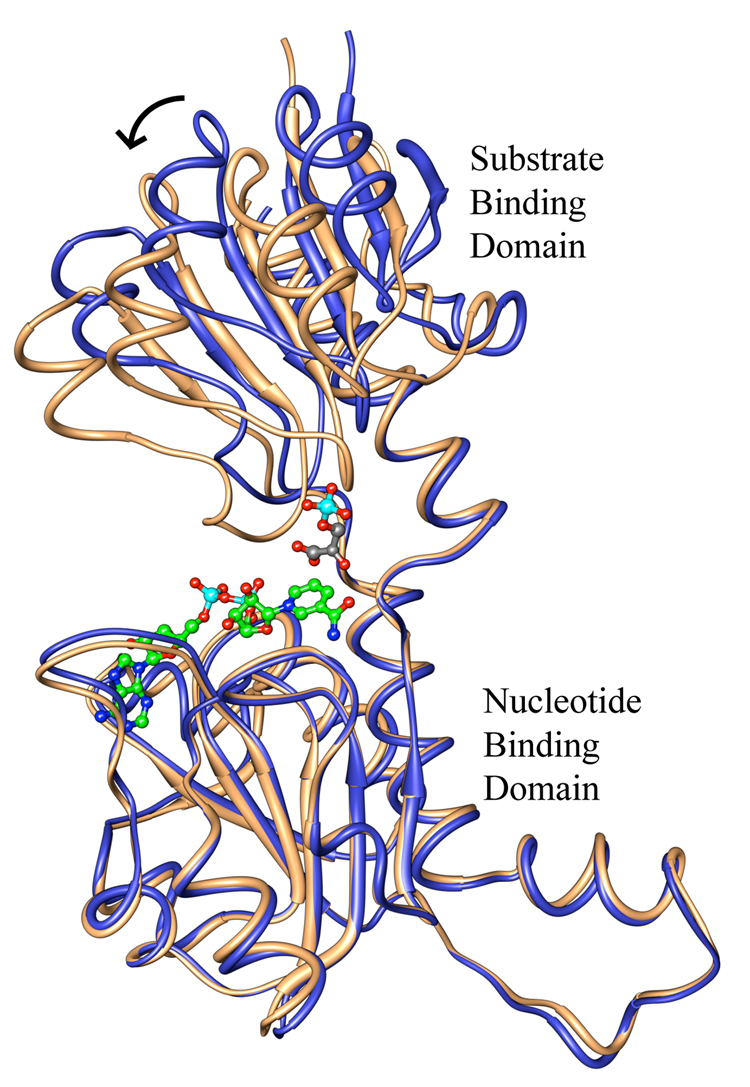
Figure 3. Model for the active site closure of M.tb PGDH upon substrate binding.
A ribbon diagram of the M.tb. apoenzyme (blue) is superimposed on a modeled ribbon diagram of M.tb. PGDH (gold) based on the malate and NAD bound human PGDH structure (pdb code 2G76). NADH (green) and HPAP (gray) are shown in ball and stick form. As seen in the figure, there is a rotation of approximately 15° (arrow) of the substrate binding domain in response to substrate and cofactor binding. The intervening domain and the regulatory domain are not shown for the sake of clarity.

