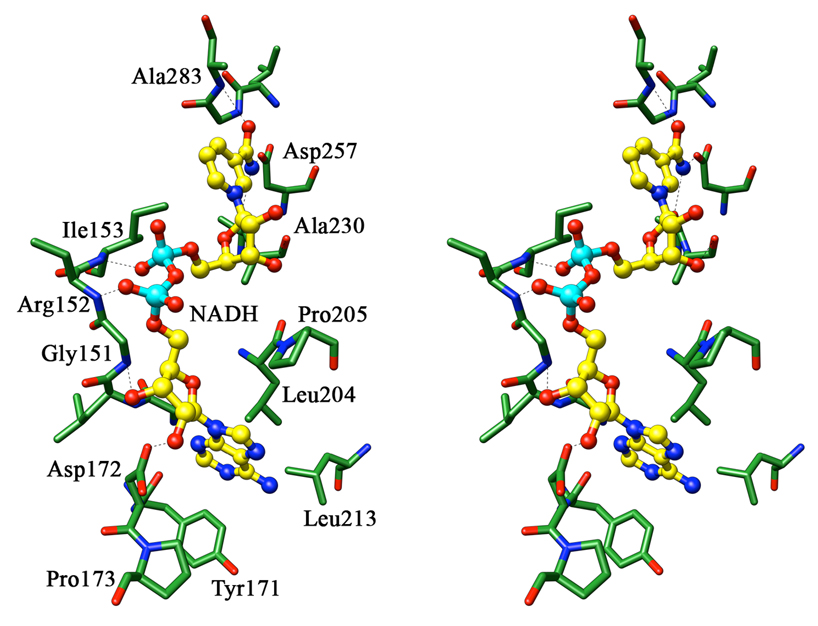
Figure 4. The cofactor binding site of chain B of M. tb PGDH with cofactor modeled into the site.
A stereo diagram of the interactions of cofactor modeled into the cofactor binding site of chain B of M. tb PGDH is shown. The cofactor is shown in ball and stick representation with carbon atoms in yellow, nitrogen atoms in blue, oxygen atoms in red, and phosphorus atoms in cyan. The protein is shown in green. All hydrogen bonds, represented as dashed lines, are within the distance of 3.5 Å. In this figure, the side chain of Arg152 has been truncated in order to prepare this stereo representation.

