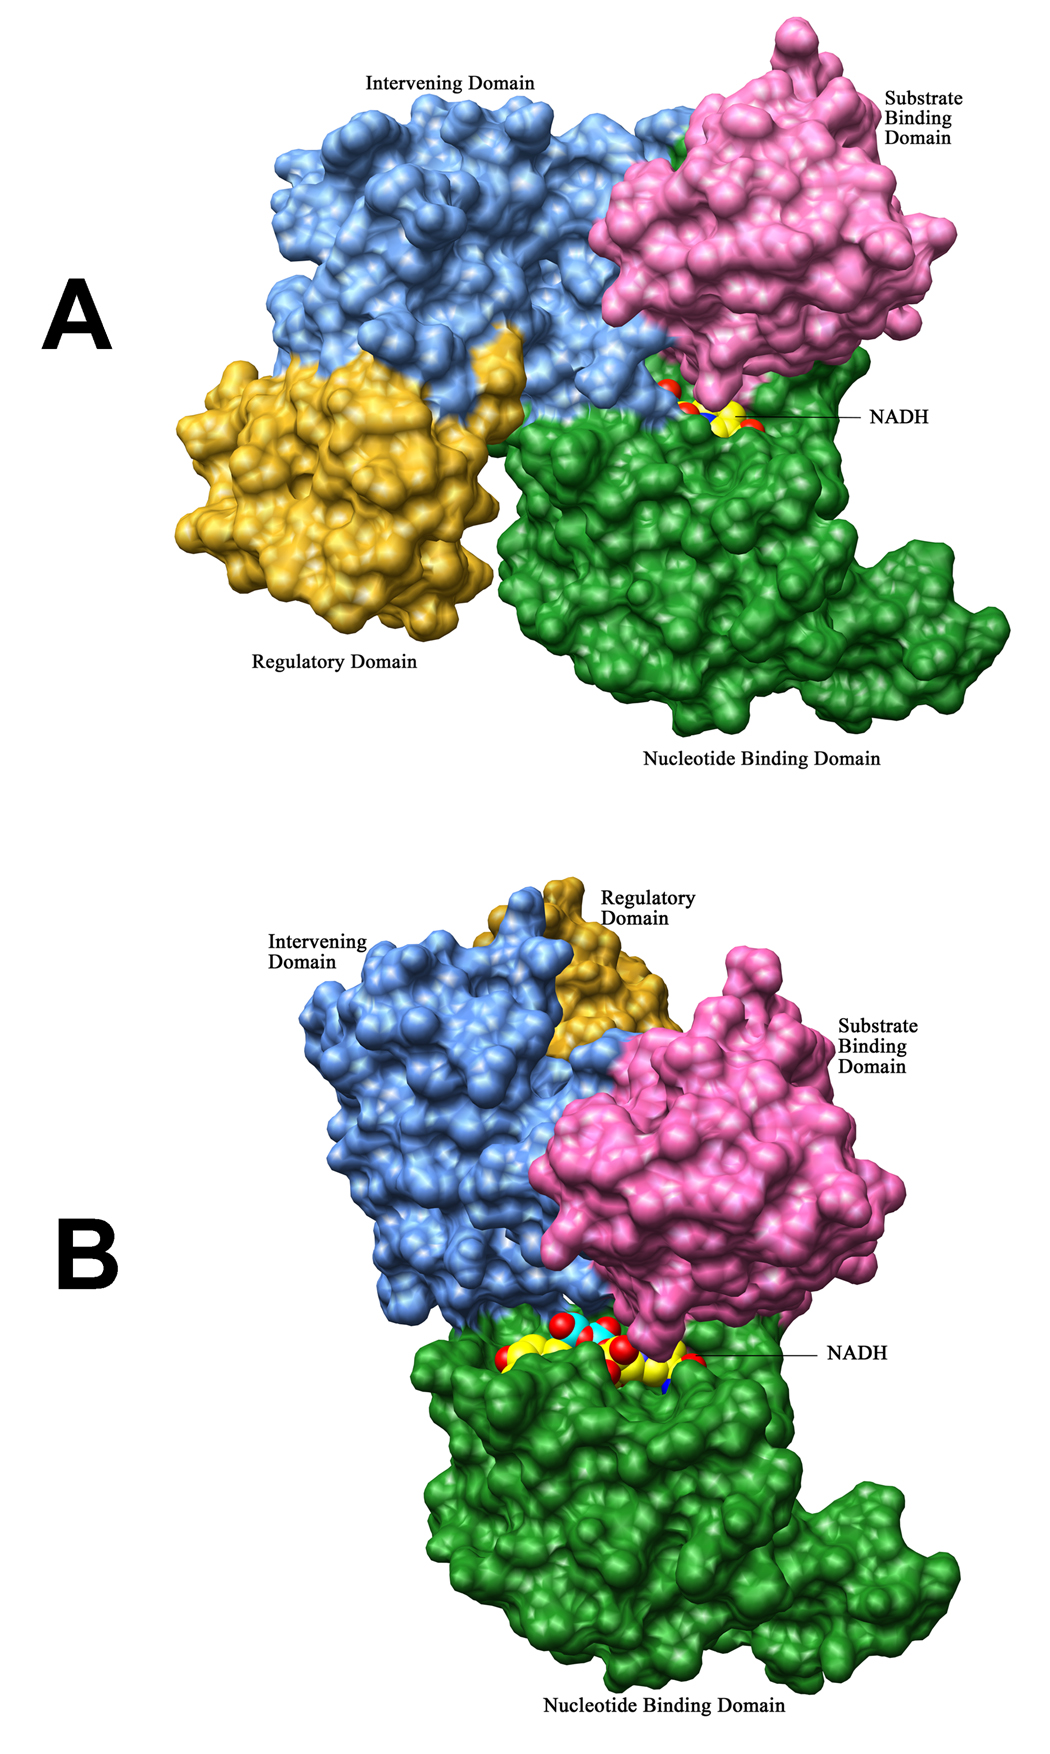
Figure 5. Modeling of NADH binding to the cofactor binding sites in Chain A and Chain B.
Molecular surface representations of M.tb PGDH chains showing the two different cofactor binding sites. In both chains, the four domains are represented with different colors: nucleotide binding domain (green), substrate binding domain (pink), intervening domain (blue) and the regulatory domain (yellow). NADH has been modeled in both figures in space filling representation (carbon atoms are in yellow, oxygen atoms are in red, nitrogen atoms are in blue, and phosphorus atoms are in aquamarine). The nucleotide (green) and substrate binding (pink) domains are orientated in the same way in both figures. (A) In chain A, the cofactor binding site resides in a channel which is formed by the intervening domain (blue) and nucleotide binding domain (green). (B) In chain B, the loop (see Figure 4), which blocks the cofactor binding site in these structures, has been placed similar to chain A. As seen in this figure, this site is now totally exposed to the solvent as the intervening domain (blue) is oriented away from the binding site.

