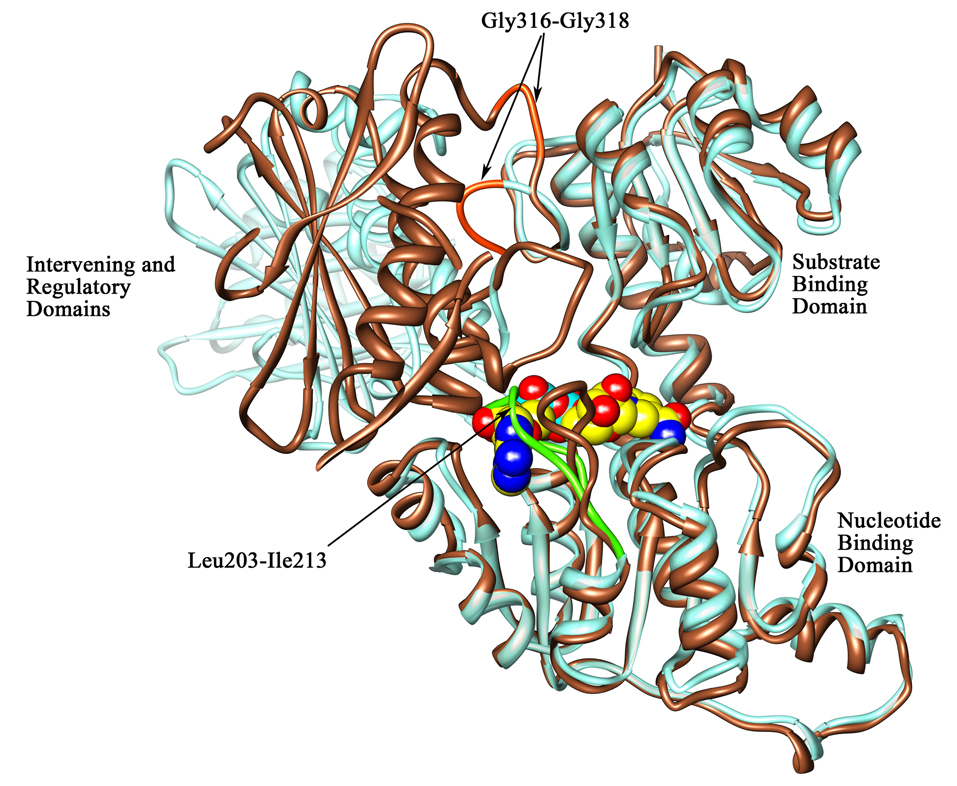
Figure 6. Orientation of the loop region at the cofactor binding site and the strand connecting the substrate binding domain to the intervening domain.
A ribbon diagram representation of the superimposition of chain A (in brown) on chain B (in aquamarine) showing the orientation of the loop region (residues 203–213 designated with arrows) at the cofactor binding site in the M.tb PGDH structures and the glycine containing strand (residues 316–318) connecting the substrate binding and intervening domains. The NADH molecule is represented in space filling representation (carbon atoms are in yellow, oxygen atoms are in red, nitrogen atoms are in blue, and phosphorus atoms are in aquamarine) and has been modeled into this site based on the E.coli PGDH structure. This figure depicts the loop movement near the cofactor binding site in both chains. As shown with an arrow, the loop region in chain B (green) falls over the cofactor binding site, thus blocking NADH from binding at this site in these crystal structures. Also apparent in this figure is the change in the domain orientation of the intervening domain-regulatory domain unit. A portion of the regulatory domain in chain A has been clipped in the front for clarity. The location of Gly316–Gly318 is shown in orange in the loop connecting the substrate binding and intervening domains.

