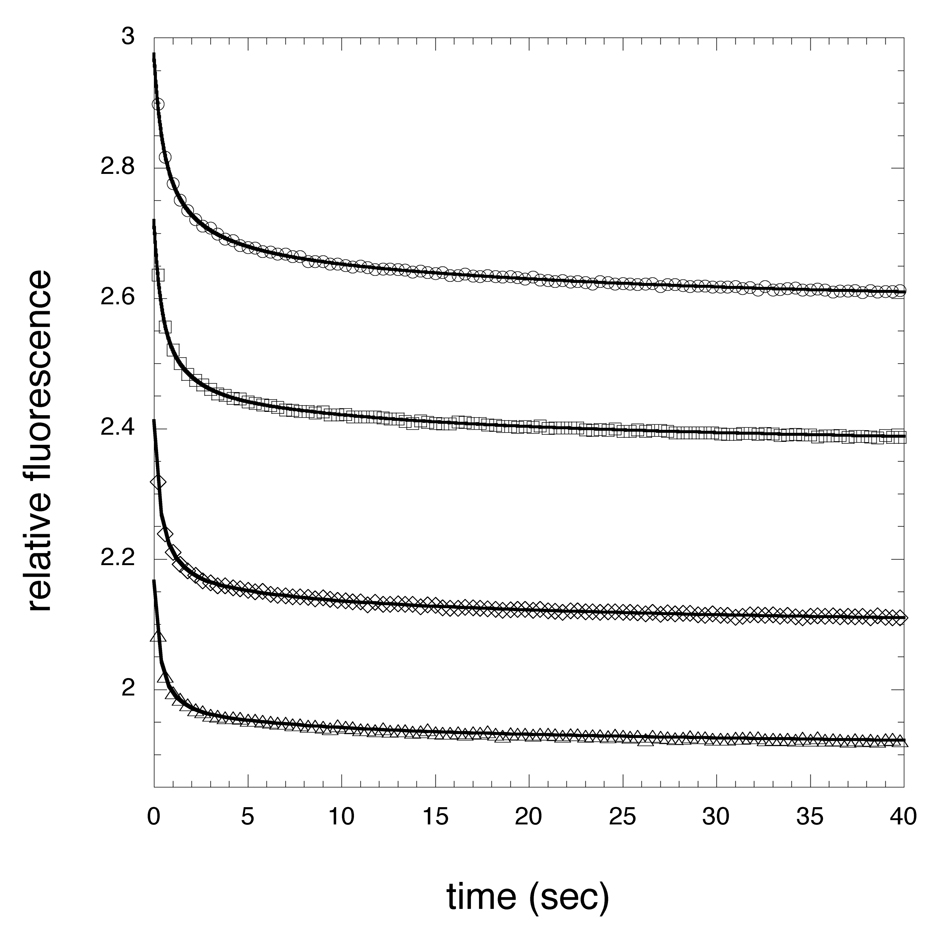
Figure 7. Pre-steady-state transients from the binding of NADH to M. tb PGDH.
The figure shows representative pre-steady state transients produced by the binding of NADH to the enzyme. The relative change in fluorescence of tryptophan upon binding of NADH is depicted by the symbols. The sample was excited at 295 nm and the fluorescence at 340 nm was recorded after rapid mixing of enzyme and NADH. Four representative transients are shown for 86 µM (○), 109 µM (□), 143 µM (◇), and 167 µM (△) NADH. The enzyme concentration was 2 µM in subunits. Only every 100th point is shown for clarity. The solid lines are the fits to the data using equation 3 for 4 exponentials. The binding exponentials are essentially complete within 2 sec. The remaining two exponentials represent a slow conformational change over the 2–40 sec range shown.

