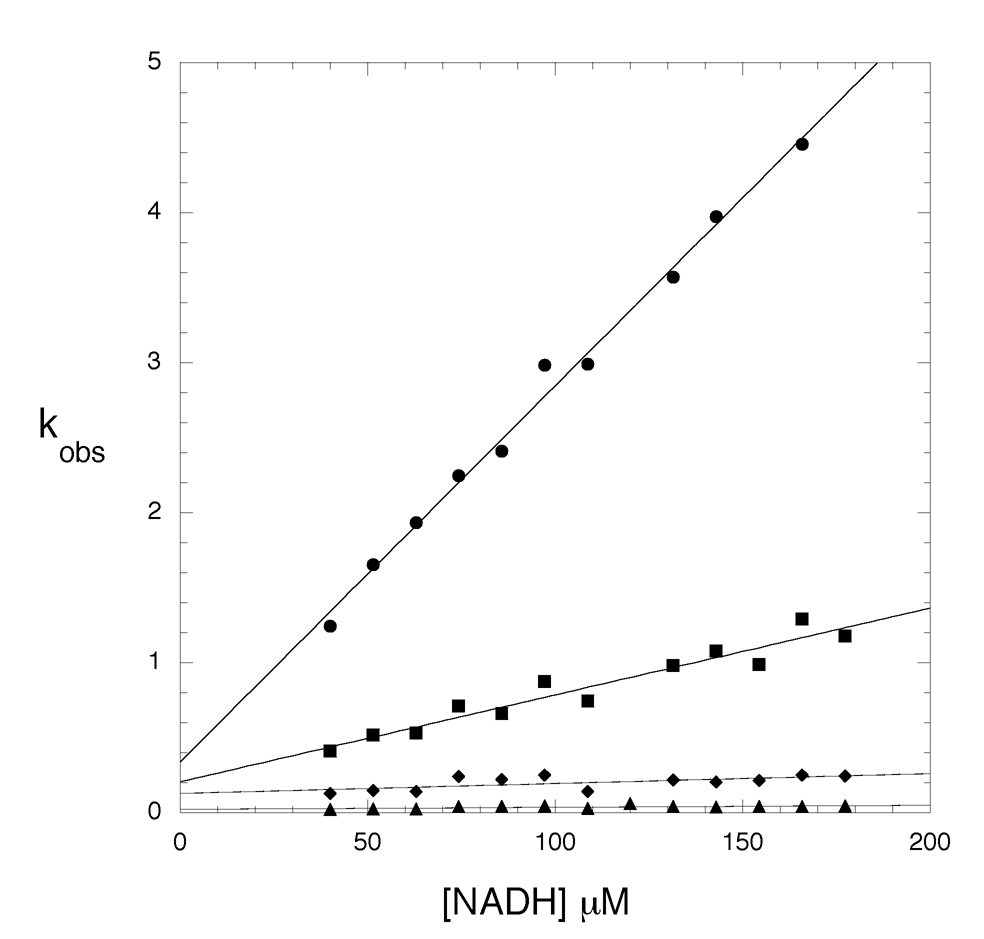
Figure 8. Plot of kobs vs NADH concentration.
The binding of NADH to M. tb. PGDH was investigated with pre-steady state transient kinetic analysis. The observed rates obtained from fitting the pre-steady state transients to an equation for four exponentials are plotted against the NADH concentration. Two concentration dependent (●, ■) and two concentration independent (◆, ▲) curves are fit to a straight line.

