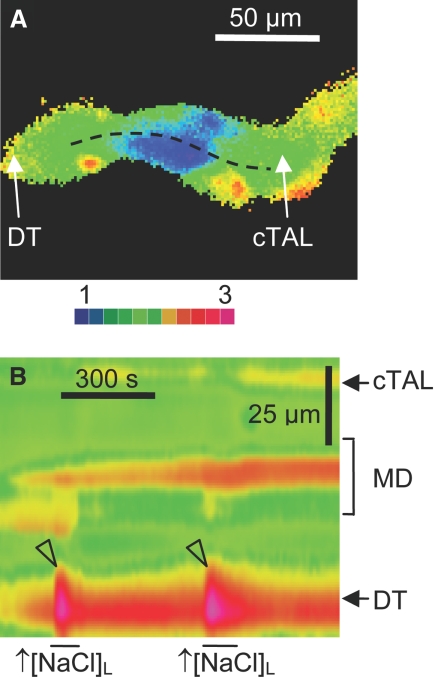
Figure 7.
Characteristics of [NaCl]L-dependent changes in [Ca2+]i in macula densa and perimacular cTAL cells. (A and B) Wide-field fura-2 ratio (A) and pseudolinescan image (B) obtained along the line illustrated in A. Note the robust increases in [Ca2+]i in the early DT upon increases in [NaCl]L from 20 to 80 mmol/L (arrowheads).

