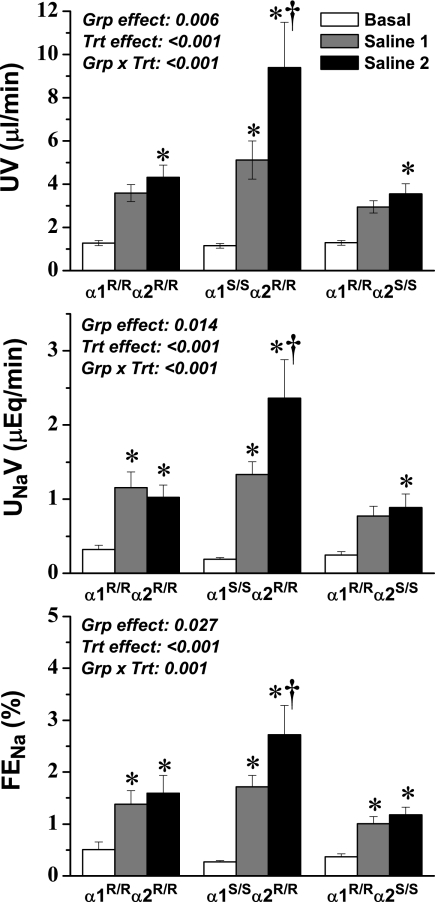
Figure 2.
UV (top), UNaV (middle), and FENa (bottom) before and during saline loading at 1 μl/min per g body wt. Two steady-state control periods were averaged and are represented as one value (Basal); two subsequent saline infusion periods are represented individually because steady state was not achieved (Saline 1 and Saline 2). ANOVA results are shown in each panel, and post hoc results are indicated by symbols: *P < 0.05 versus basal value in the same group; †P < 0.05 versus corresponding value from the α1R/Rα2R/R group.

