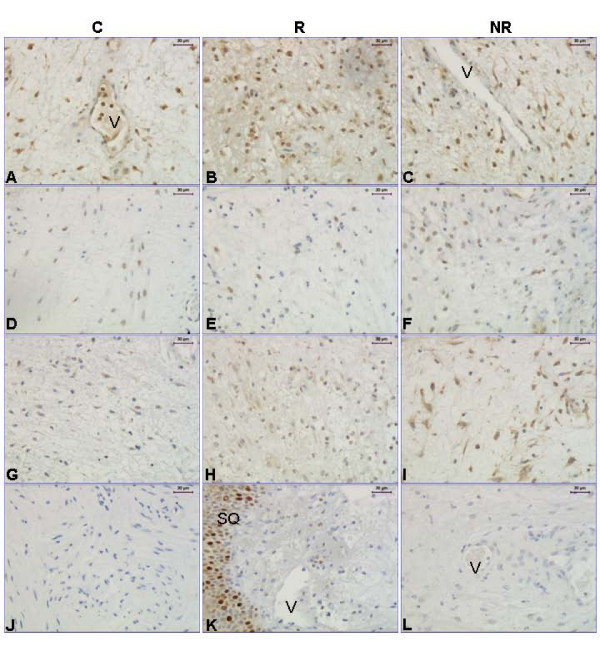
Figure 7.
Representative images of ERα, ERβ, GPR30 and Ki-67 immunostaining. Representative images of the immunostaining results for ERα (A-C), ERβ (D-F), GPR30 (G-I) and Ki-67 (K), and a negative control for monoclonal antibodies (J) where the primary antibody (in this example ERα) was replaced by an equal amount of mouse IgG. A negative control for the GPR30 polyclonal antibody, where the primary antibody was replaced by an equal amount of goat IgG, is shown in (L). Abbreviations: V: vessel and SQ: squamous epithelium. Magnification bars represent 30 μm in all images.

