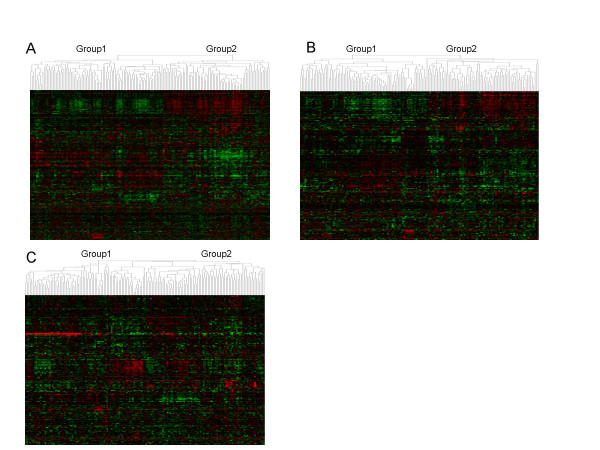
Figure 2.
Hierarchical clustering heatmap of breast cancers based on expression of genes in breast cancer gene marker set (A), cell cycle pathway (B), and NF-κB pathway (C). The dendrograms indicated that patients are clustered into two groups (Group1 and Group2) according to their expression patterns of the specified gene set.

