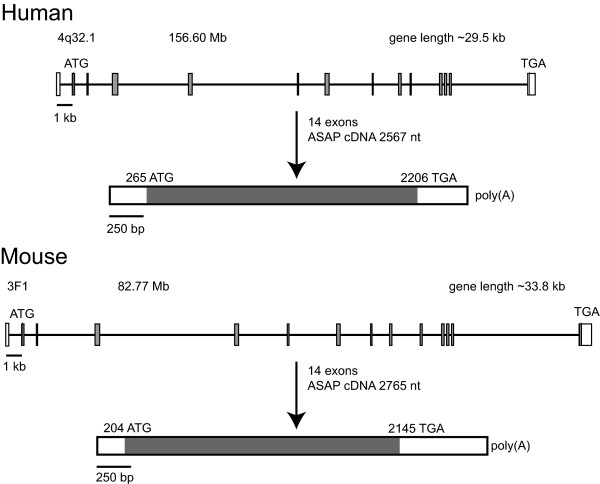
Figure 1.
Comparison of the ASAP gene structure in human and mouse. The coding regions are represented by horizontal solid lines and the exons by closed boxes. The ATG start codons and the TGA stop codons are indicated, as well as the chromosome locations (cytogenetic bands and nucleotide locations in Mb). The transcribed mRNAs are represented below each gene.

