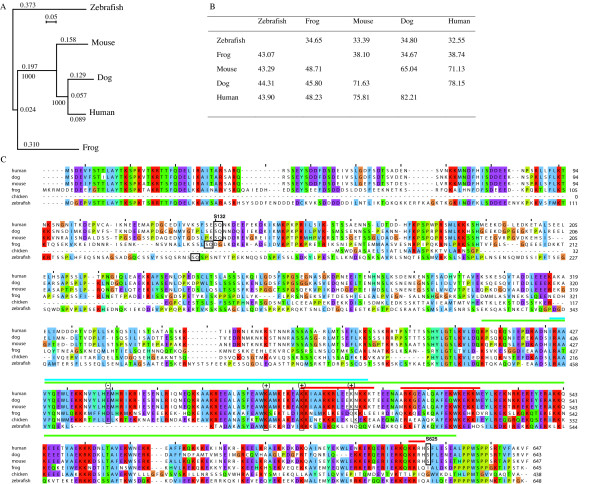
Figure 2.
Phylogenetic analysis and pairwise comparison of ASAP from different species. (A) Phylogenetic tree of the ASAP protein from fish, frog, mouse, dog and human. The predicted protein sequences were compared using the ClustalW software to generate a rooted phylogenetic tree using the bootstrap method. Branch length and bootstrap numbers are indicated. (B) Pairwise comparison (%) of ASAP proteins between the species depicted in A. The values above the diagonal show protein sequence identities, those under the diagonal show protein sequence similarities. These values were estimated using the Gap program of the GCG package. (C) Clustal alignment of the phylogenetic analysis performed in (A) plus a partial chicken sequence, visualized using Jalview and Clustal X colour codes [63]. On top of the aligment, colour bars indicate conserved domains; blue, MIT-like; green, MAP; red, NLS. Phosphoserines 132 (SQ motif) and 625 are squared. Canonical (+) and (-) residues of the MIT domain are squared.

