Figure 7.
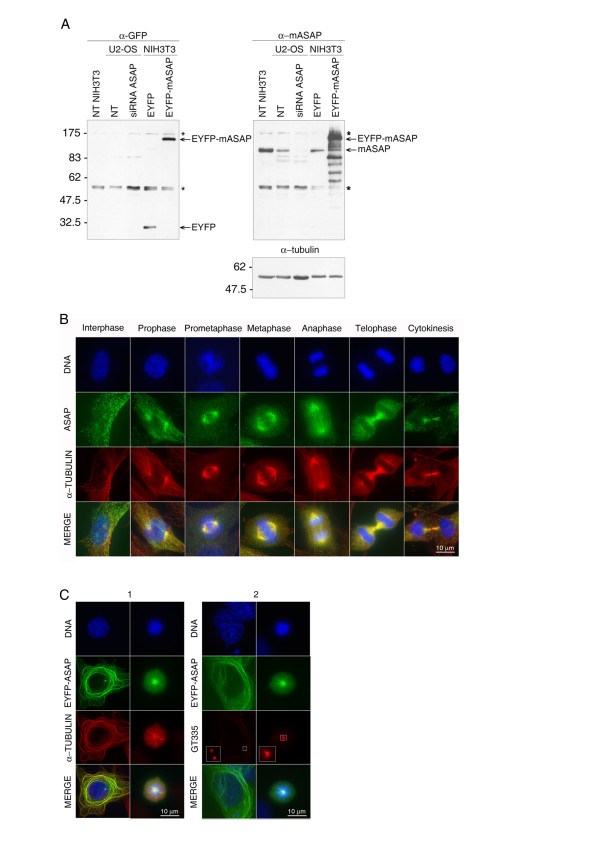
Characterization of the mouse ASAP. (A) Characterization of anti-mouse ASAP antibodies by immunoblotting. Non-transfected (NT) or transfected U2-OS (with a human ASAP siRNA) or NIH3T3 (with EYFP or EYFP-mASAP) cells were blotted first with an anti-GFP (left), then with the anti-mASAP (right). The specificity of the affinity-purified anti-mASAP antibody was assessed by using cell extracts from NIH3T3 and U2-OS (right), and compared to the profile observed 1) after ASAP-depletion by siRNA in the U2-OS cells (right) and 2) with the anti-GFP antibody against EYFP-mASAP transfected NIH3T3 cells (left). * : non specific bands observed with the α-GFP and that still show up in the α-mASAP blot since the same membrane was used. The same blot was finally probed with an anti-α-tubulin to demonstrate equal loading (bottom). The sizes of molecular weight marker are shown on the left. (B) Subcellular localization of endogenous mASAP during the cell cycle. Exponentially growing NIH3T3 cells were fixed with PFA and processed for immunofluorescence with the affinity-purified antibody against mASAP (green), and an antibody against α-tubulin (red). DNA was stained with Hoechst dye 33258 (blue). (C) Overexpression of mASAP leads to MTs bundles and monopolar spindle formation in NIH3T3 cells. Forty-eight hours after transfection with 2 μg of EYFP-mASAP, cells were fixed with PFA and stained with an anti-α-tubulin (1) or an anti-GT335 (2) (red) and Hoechst 33258 (DNA). Insets show a higher magnification of GT-335 foci. EYFP signals are in green. (Bars, 10 μm).

