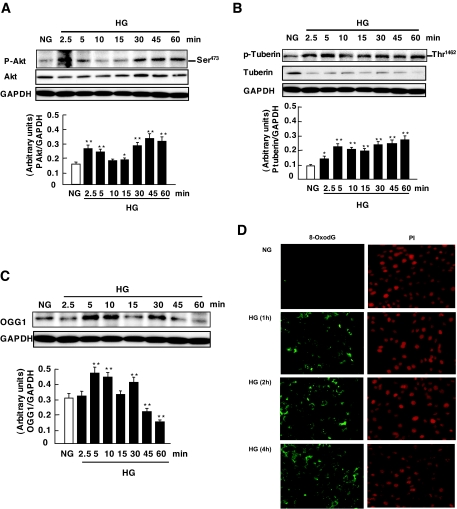
FIG. 3.
Effects of high glucose (HG) on Akt/PKB and tuberin phosphorylation and OGG1 expression in MCT cells. A–C: Representative immunoblot shows an increase in phospho-Akt (p-Akt) (A) and phospho-tuberin (p-tuberin) (B) in MCT cells treated with high glucose (25 mmol/l glucose d-glucose) for the time periods indicated. GAPDH was used as loading control. Histograms in the bottom panel represent means ± SE of three independent experiments. Significant difference from nontreated cells is indicated by *P < 0.05 and **P < 0.01. D: Immunoflourescence shows an increase in mitochondrial and nuclear 8-oxodG staining in MCT treated with high glucose for 1 h—an effect that was more intense at 2 and 4 h compared with normal glucose. FITC for 8-oxodG (green color) and propidium iodide for nuclear staining (red color) were detected with excitation wavelengths at 450–490 nm and 535 nm, respectively. NG, normal glucose. (Please see http://dx.doi.org/10.2337/db07-1579 for a high-quality digital representation of this figure.)

