FIG. 7.
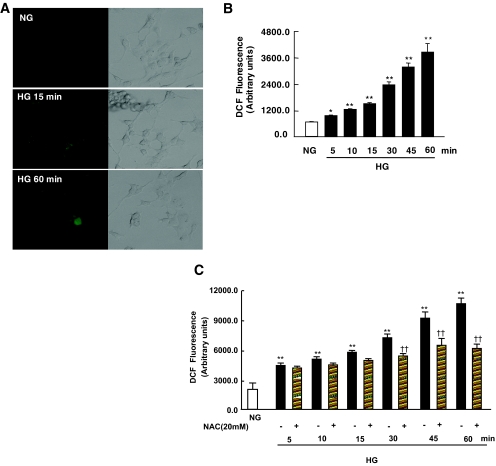
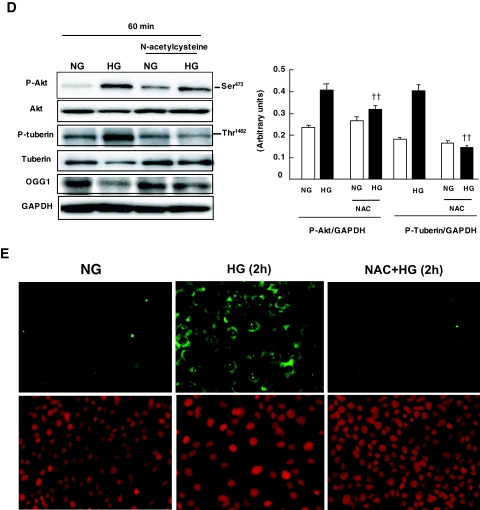
Effect of high glucose (HG) concentration on the production of ROS in MCT cells. A: DCF fluorescence reflecting the relative levels of ROS was imaged with a confocal laser scanning fluorescence microscope in serum-deprived MCT cells treated with high glucose for the indicated time periods. B: DCF fluorescence was measured using the peroxide-sensitive fluorescent probe DCF-DA by a multiwell fluorescence plate reader in intact MCT cells treated with high glucose. Histogram represents means ± SE of three independent experiments. Significant difference from nontreated cells is indicated by *P < 0.05 and **P < 0.01. C: NAC blocks ROS generation measured using the peroxide-sensitive fluorescent probe DCF-DA in MCT cells treated with high glucose. Histogram represents means ± SE of three independent experiments. Significant difference from normal glucose (NG) is indicated by **P < 0.01 and from cells treated with NAC versus high glucose alone is indicated by ††P < 0.01. D: Effect of NAC on high glucose–induced Akt/PKB and tuberin phosphorylation and OGG1 expression in MCT cells. Representative immunoblot shows a decrease in phospho-Akt (p-Akt) and phospho-tuberin (p-tuberin) and an increase in OGG1 expression in cells preincubated with NAC before exposure to high glucose. E: NAC blocks 8-oxodG generation in cells treated with high glucose. Immunoflourescence shows a decrease in mitochondrial and nuclear 8-oxodG staining in MCT pretreated with NAC compared with cells treated with high glucose alone for 2 h. (Please see http://dx.doi.org/10.2337/db07-1579 for a high-quality digital representation of this image.)


