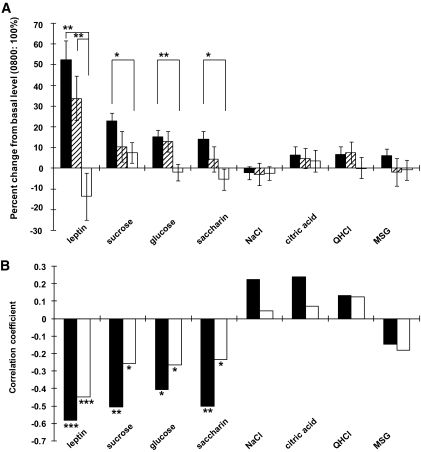
FIG. 2.
A: Percent changes in plasma leptin levels and taste recognition thresholds at 2200 h compared with basal values collected at 0800 h (control = 100%). Statistical analysis (t test) for differences in 2200 h values among meal conditions was done by using raw values. n = 47 subjects tested (44 for saccharin) for three meals (▪), n = 16 for two meals (▒), and n = 24 for one meal (□). **P < 0.01 (t test), *P < 0.05. B: Correlation coefficients between postingestive increases in blood glucose (□) or insulin (▪) levels after dinner (at 1900 h) versus leptin levels and recognition thresholds for sucrose, glucose, saccharin, NaCl, HCl, quinine, or MSG before dinner (at 1700 h) among individuals (n = 32–82). Correlation coefficients were obtained by using data for all subjects having a common dinner, thereby consuming the same calorie (1,000 kcal) and nutritional contents regardless of whether they had breakfast and/or lunch before dinner. ***P < 0.001 (t test), **P < 0.01, *P < 0.05.

