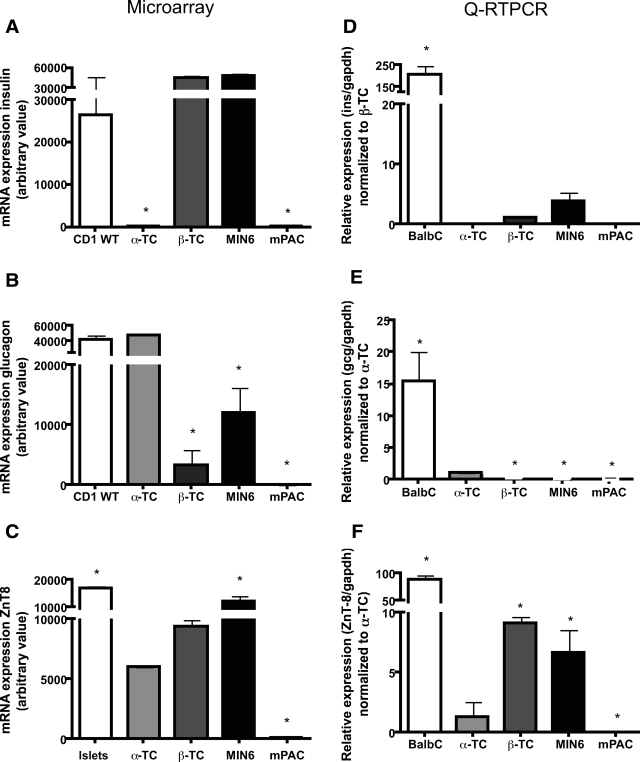
FIG. 1.
Expression of insulin, glucagon, and zinc transporter eight in islets and mouse tumor cell lines. A–C: Microarray analyses: the normalized intensity from data obtained on the MOE 430 2.0 Affymetrix chip is the mean ± SD from two arrays. D–F: qRT-PCR of insulin, glucagon, and ZnT8 mRNA. cDNA synthesized from islets and cells was analyzed with a 5′ nuclease assay and FAM dye–labeled TaQman MGB probes with two PCR primers. Endogenous glyceraldehyde-3-phosphate dehydrogenase (gapdh) was used for normalization. Data (means ± SD) are expressed relative to a control sample (listed on the y-axis). For statistical analysis, one-way ANOVA probability value (P < 0.05) was considered significant, followed by Student's t test (P < 0.05).

