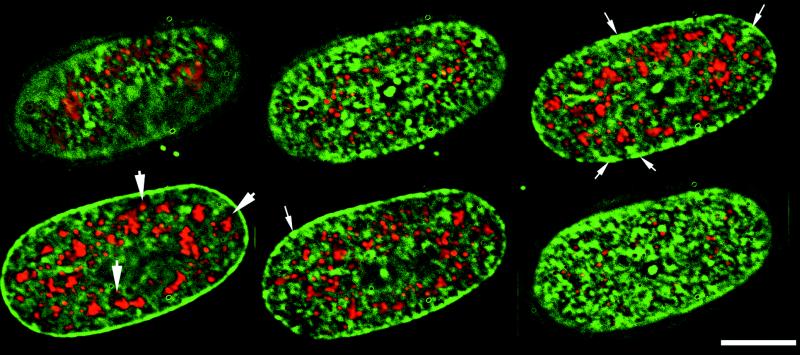
Figure 1.
Organization of DNA within the fibroblast nucleus. Digitally deconvolved optical sections of 0.4 μm were independently collected for anti-DNA and anti-SC35 staining. The distribution of DNA is shown in green, and the distribution of SC-35 is shown in red. Sections are shown at 0.8-μm intervals and proceed from left to right. The first two images show sections farthest from the growth surface, and the last image represents the nuclear surface closest to the growth attachment site. The large arrows indicate chromatin-depleted regions, whereas the small arrows indicate regions of highly condensed chromatin. Bar, 10 μm.

