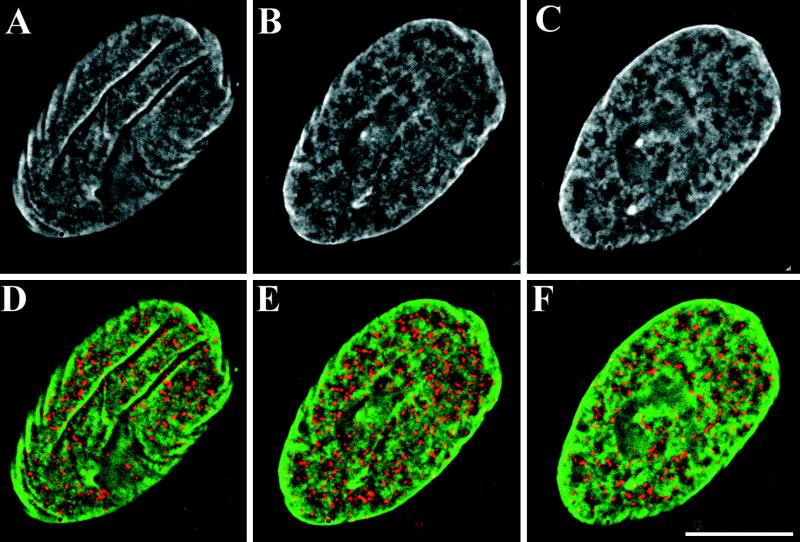
Figure 4.
Distribution of HDAC1 in fibroblast cell nuclei. Consecutive digitally deconvolved optical sections of an Indian muntjac fibroblast cell nucleus costained with anti-HDAC-1 and DAPI is shown. Sections of 0.4 μm are shown at 0.8-μm intervals. (A–C) Distribution of DAPI alone. (D–F) Distribution of both DAPI (green) and HDAC-1 (red). Bar, 0.4 μm.

