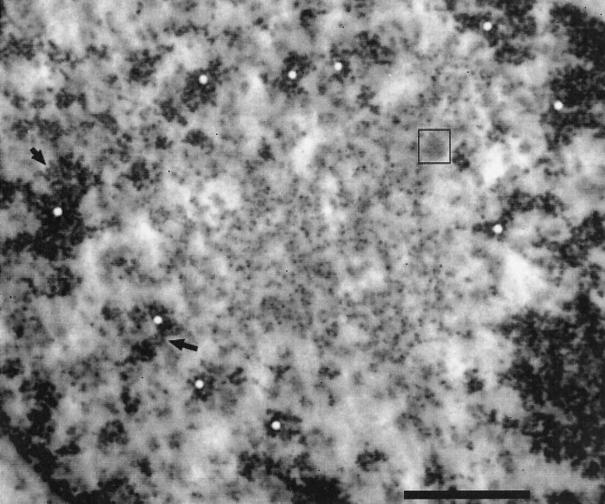
Figure 6.
The ultrastructure of IGCs and the surrounding nucleoplasm. Indian muntjac cell nuclei were imaged using ESI at 155 eV energy loss. The white dots indicate small “condensed” regions of chromatin potentially associated with the IGC. The image is displayed as dark on a light background. Bar, 1 μm.

