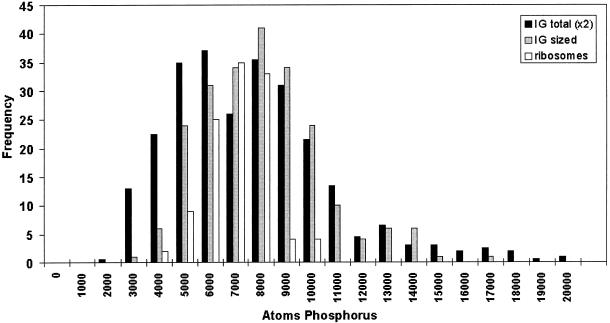
Figure 9.
Quantitation of phosphorus within interchromatin granules. A frequency histogram is shown of the measured phosphorus contents of the Indian muntjac interchromatin granule population. Individual granules from interphase cells were quantitated using ribosomes as an internal phosphorus standard. The total interchromatin granule population (the actual frequency is two times the value represented on the y-axis for the total interchromatin granule population), a subset representing the median area ± 0.5 SD, and the ribosome standard are plotted.

