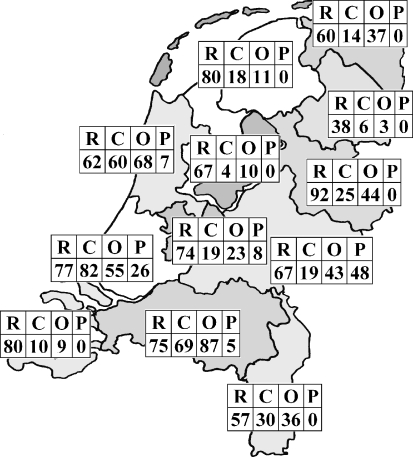
Fig. 1.
Response rates and the number of patients treated using the three most frequently applied modalities per province in the Netherlands. R=response rate in percentage; C=absolute number of patients treated conservatively; O=absolute number of patients treated using ORIF; P=absolute number of patients treated percutaneously, as described by Forgon and Zadravecz

