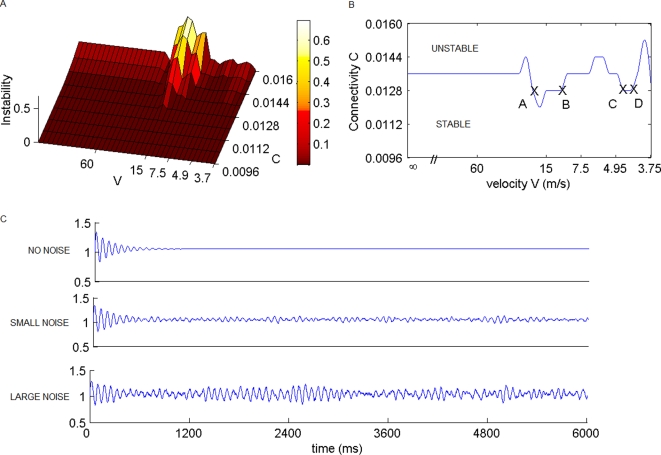
Figure 3. Stability regimes.
(A) The degree of instability, equivalent to Re[λ], is plotted as a function of connection strength c and propagation velocity v. (B) The critical boundary, equivalent to Re[λ] = 0, is plotted as a contour line separating unstable and stable regions. (C) Representative time series illustrate the effect of noise upon a single neural population model close to the onset of instability with no noise, small and large noise strength (top-down).

