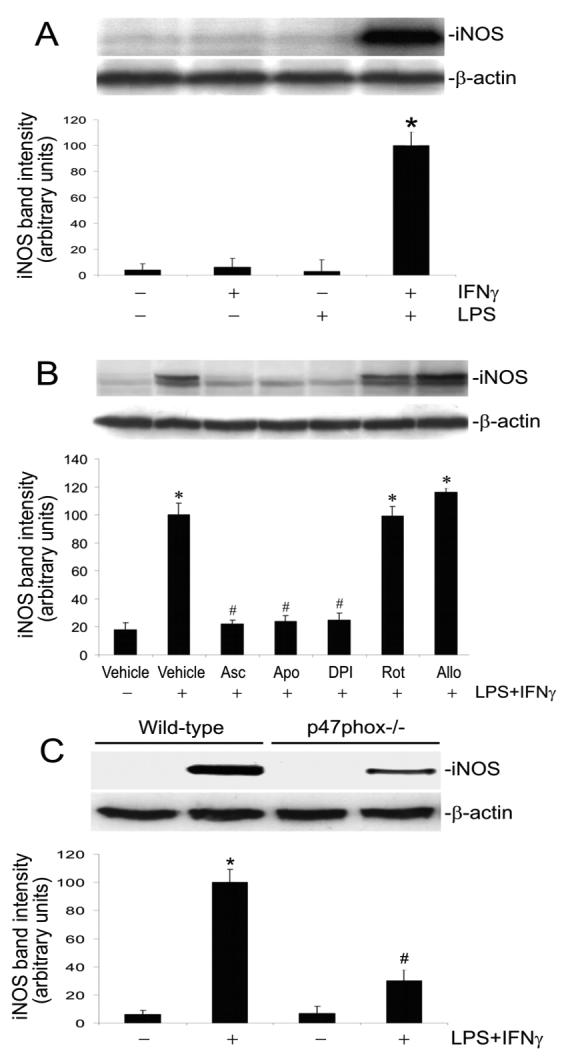
Fig. 3.

Suppression of NADPH oxidase activity attenuates iNOS induction. A: Endothelial cells were incubated for 24 h with vehicle, IFNγ, LPS, or LPS+IFNγ and then were harvested for Western blot analysis. Shown are iNOS and β-actin Western blot examples and the summary of iNOS protein band intensities (expressed in arbitrary units; mean ± SEM values for three experiments). *Significant difference from the vehicle, IFNγ alone, and LPS alone (P < 0.05). B: Endothelial cells were pretreated with vehicle, ascorbate (Asc, 500 μM, 12 h), apocynin (Apo, 250 μM, 1 h), DPI (10 μM, 1 h), rotenone (Rot, 10 μM, 1 h) or allopurinol (Allo, 100 μM, 1 h). Subsequently they were incubated with the same drugs plus LPS+IFNγ for another 24 h, and then harvested for Western blot analysis. Shown are iNOS and β-actin Western blot examples and the summary of iNOS protein band intensities (expressed in arbitrary units; mean ± SEM values for three experiments). *Significant difference from the vehicle group (P < 0.05). #Significant difference from the LPS+IFNγ group (P < 0.05). C: Wild type and p47phox phox knockout endothelial cells were incubated with vehicle or LPS+IFNγ for 24 h. Shown are iNOS and β-actin Western blot examples and the summary of iNOS protein band intensities (expressed in arbitrary units; mean ± SEM values for three experiments). *Significant difference from the vehicle group (P < 0.05). #Significant difference from the wild type LPS+IFNγ group (P < 0.05).
