
Fig. 3.
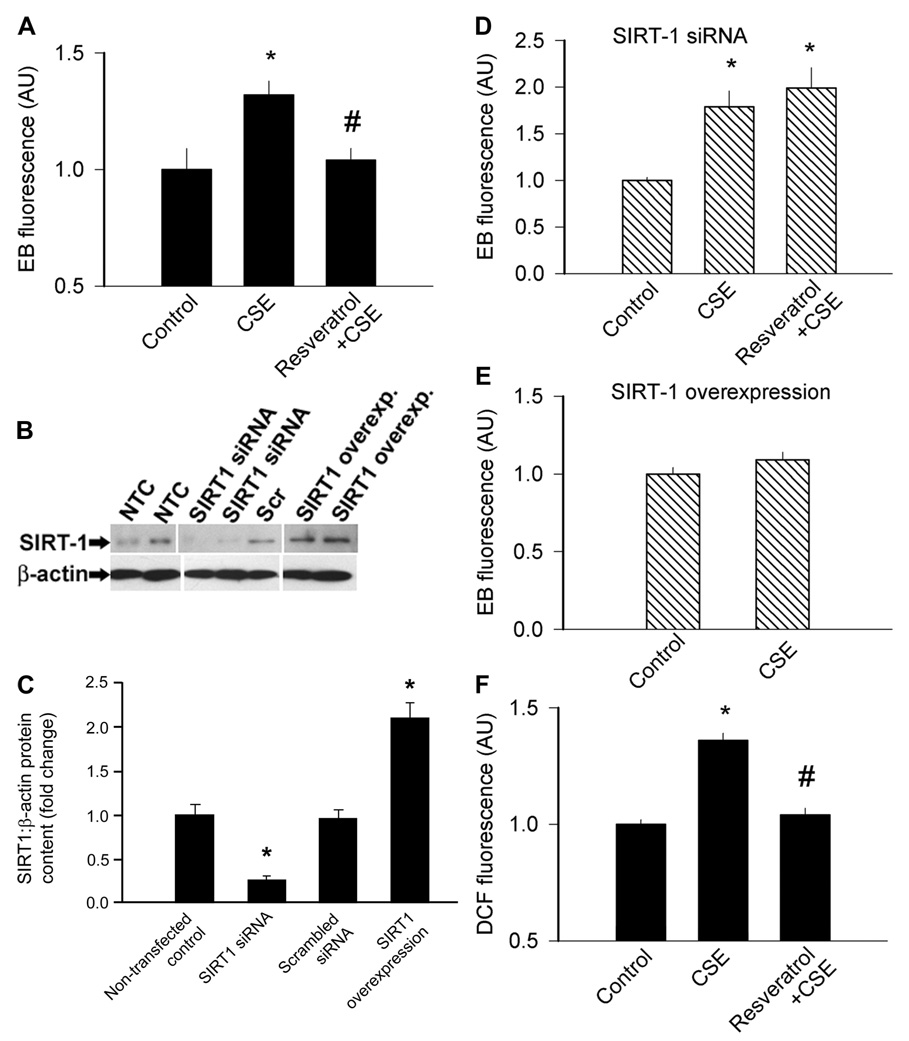
A: summary data from dihydroethidine staining experiments showing the time-dependent buildup of EB fluorescence in coronary arterial endothelial cells (CAECs). Bar graphs are summary data for slope factors normalized to cell number (i.e., nuclear DNA content, assessed by Hoechst fluorescence intensity), representing cellular O2 •− production. CSE (4 µg/ml) elicited significant increases in cellular O2 •− generation, which were prevented by Res (10 µmol/l) pretreatment (A). B: original Western blot showing downregulation of sirtuin 1 (SIRT1) in small-interfering RNA (siRNA)-treated CAECs. NTC, nontransfected control; Scr, scrambled siRNA. The effect of overexpression of SIRT1 is also shown. β-actin was used for normalization. Bar graphs (C) are summary densitometric data. Data are means ± SE. *P <0.05 vs. NTC. D: knockdown of SIRT1 (siRNA) in CAECs prevented the inhibitory effect of Res on CSE-induced oxidative stress. E: overexpression of SIRT1 in CAECs prevented CSE-induced oxidative stress, mimicking the effects of Res. F: CSE also significantly increased H2O2 production in CAECs [as shown by the dichlorofluorescein (DCF) fluorescence method], which was prevented by Res pretreatment. Data are means ± SE; n = 8 animals for each group. *P <0.05 vs. untreated; #P <0.05 vs. no Res. Overexp, overexpression.