Fig. 4.

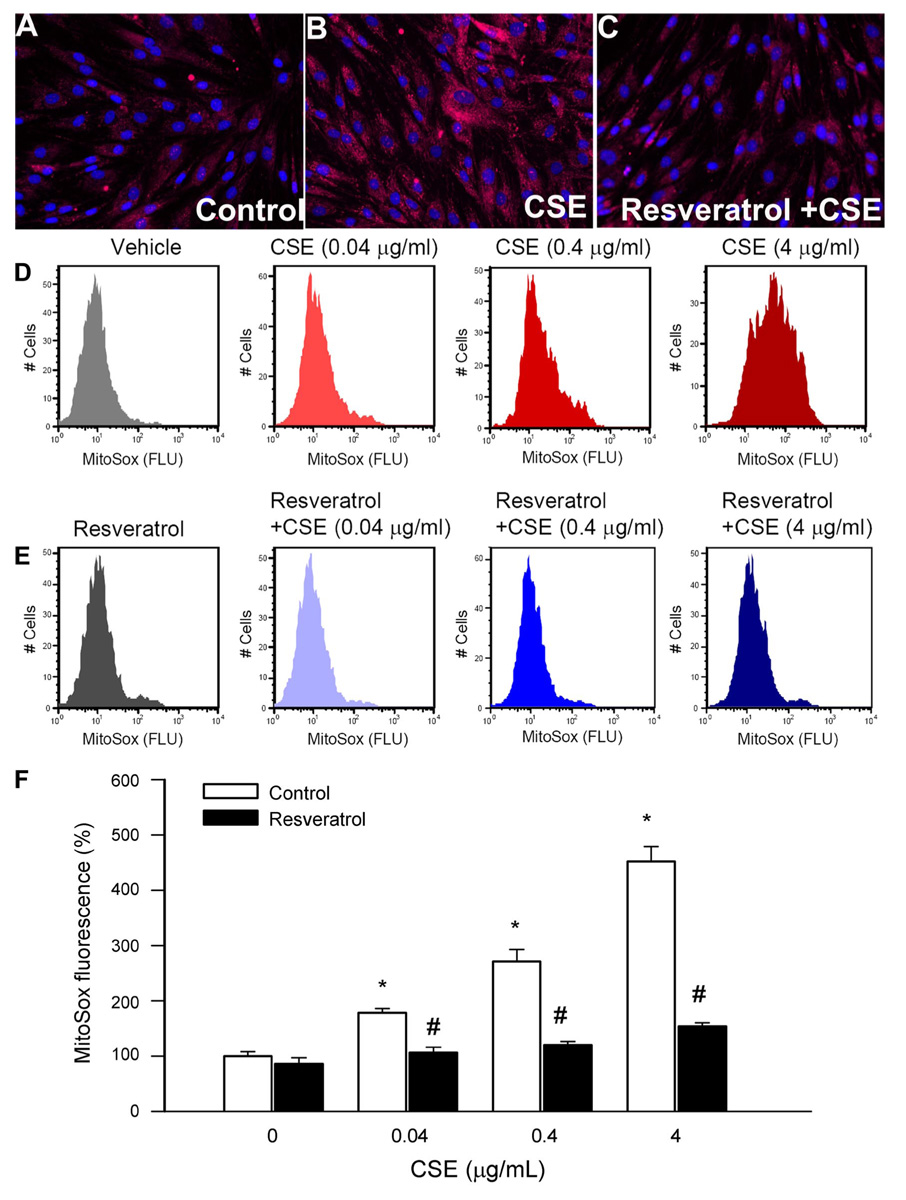
A–C: representative fluorescent images showing stronger perinuclear MitoSox staining [red fluorescence (Flu)] in CSE (4 µg/ml)-treated cells (B) compared with untreated controls (A). C: Res (10 µmol/l) pretreatment substantially attenuated CSE-induced mitochondrial O2 •− generation. Hoechst 33258 (blue fluorescence) was used for nuclear staining (original magnification, ×20). D–E: representative histograms of flow cytometry experiments demonstrating that CSE in a dose-dependent manner (D) elicits significant increases in mean fluorescent intensity of oxidized MitoSOX in CAECs, which were prevented by Res pretreatment (E). The experiments were performed in quadruplicates with identical results. F: summary data. Data are means ± SE. *P < 0.05 vs. untreated; #P < 0.05 vs. no Res.
