Figure 3.
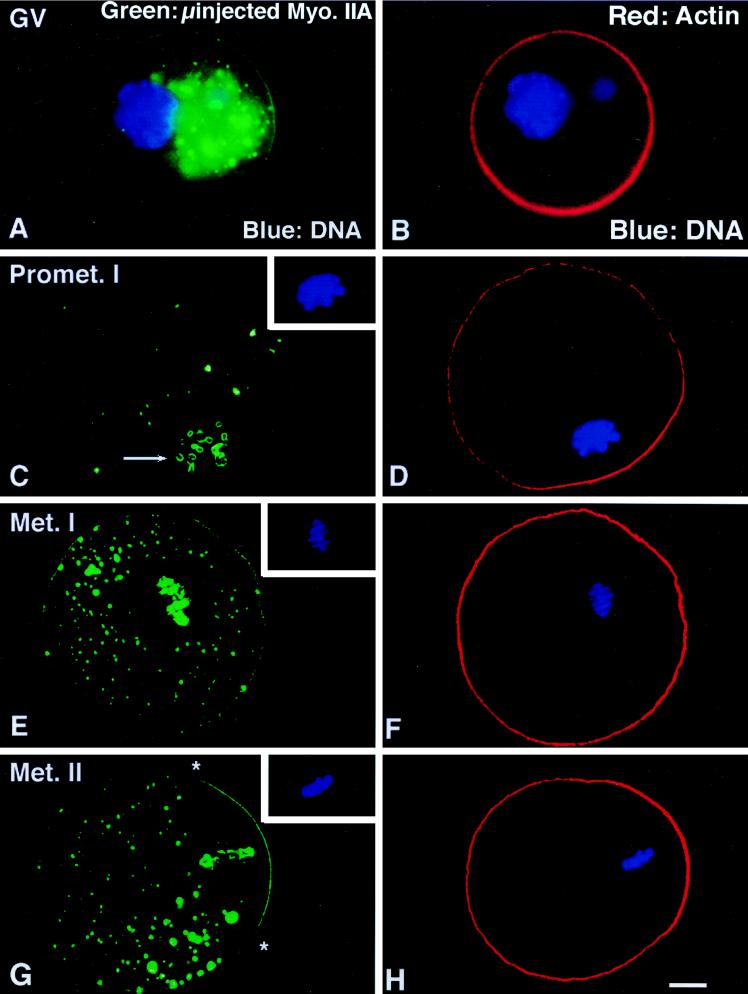
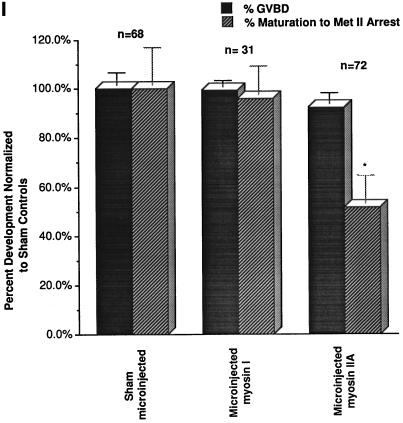
Microinjection of myosin IIA antibody blocks the eccentric positioning of the metaphase I spindle during meiotic maturation. (A and B) Microinjection of myosin IIA antibody into GV-arrested oocytes reduces myosin IIA, but not actin filaments, in the cortex and results in the formation of large immunofluorescent aggregates within the cytoplasm. (C and D) By 16 h after microinjection of myosin IIA antibody, oocytes arrested at prometaphase I (C, inset) demonstrate cytoplasmic myosin aggregates, a reduced cortical intensity of myosin IIA, and peripheral staining of chromosomal surfaces (C, arrow). Cortical actin enhancement overlying the peripheral chromosomes is not influenced after microinjection of the myosin IIA antibody (D). (E and F) In E, a GV stage oocyte microinjected with myosin IIA antibody has arrested at metaphase I (inset, DNA). Myosin IIA is not detected in the meiotic spindle region, except at surfaces of the aligned equatorial chromosomes. The large cytoplasmic immunofluorescent aggregates which form after microinjection of myosin IIA antibody are also excluded from the meiotic spindle region. Actin filaments remain uniform in the cortex of metaphase I-blocked oocytes. (G and H) In G, a GV stage oocyte microinjected with myosin IIA antibody has arrested at metaphase of second meiosis (inset, DNA). Both cortical myosin IIA and actin filaments are enhanced in the region overlying the spindle (∗, spindle region). Microinjection of myosin IIA antibody eliminates myosin IIA detection in the meiotic spindle but labels the peripheries of the meiotic chromosomes. (I) An analysis of the impact of microinjected myosin antibodies on meiotic maturation in vitro demonstrates that GVBD is not prevented in the presence of either myosin I or myosin IIA antibodies (solid bars), but completion of meiotic maturation to metaphase II arrest is significantly reduced by the IIA antibody (stippled bars). ∗, significant difference compared with microinjected sham controls (p < 0.001). All images triple labeled for myosin IIA (green), actin (red), and DNA (blue). (A and B) epifluorescence. (C–H) Laser scanning confocal microscopy. (I) Graph of the mean ± SD. Bar, 10 μm.


