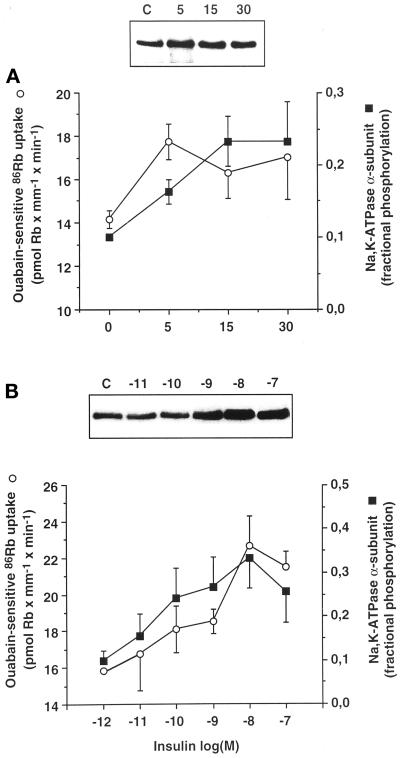
Figure 10.
The time course and the dose dependence of insulin-induced tyrosine phosphorylation of the Na+,K+-ATPase α-subunit and stimulation of the ouabain-sensitive 86Rb uptake are similar in rat PCT. (A) The tyrosine phosphorylation of the α-subunit of Na+,K+-ATPase from kidney proximal tubules (closed squares) and ouabain-sensitive 86Rb uptake by isolated PCTs (open circles) was determined after 30 min preincubation at 37°C. Prewarmed insulin solution (10−8 M final) was added or not for various times (5–30 min). Upper panel, typical immunoblot with McK1 antibody showing the amount of α-subunit immunoprecipitated with the PY20 antibody. Lower panel, averaged results expressed as fractional tyrosine phosphorylation of the α-subunit (assuming that 10% of α-subunits are phosphorylated under baseline) and as pmol Rb × mm−1 × min−1 were plotted on the same graph and are means ± SEM from five or six independent experiments. (B) The tyrosine phosphorylation of the α-subunit of Na+,K+-ATPase from proximal tubules (closed squares) and ouabain-sensitive 86Rb uptake by isolated PCTs (open circles) was determined after preincubation for 30 min in the absence (C) or presence of various concentrations of insulin. Upper panel, typical immunoblot with McK1 antibody showing the amount of α-subunit immunoprecipitated with the PY20 antibody. Lower panel, averaged results expressed as in A were plotted on the same graph and are means ± SEM from five or six independent experiments.

