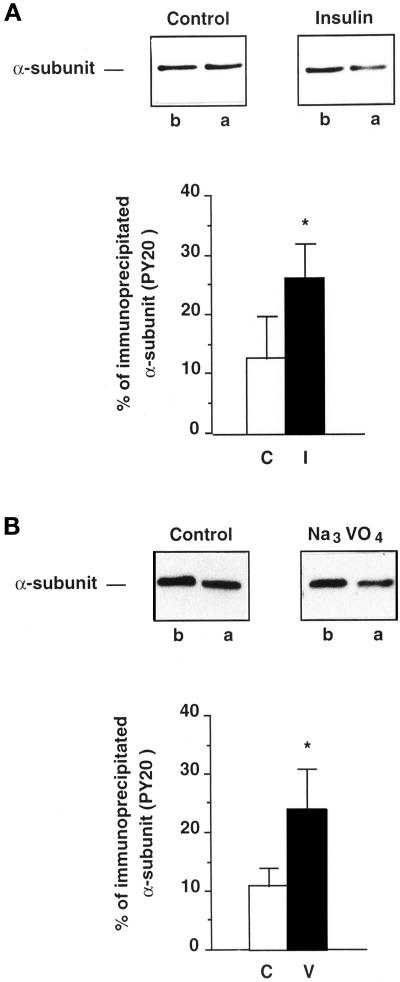
Figure 5.
Estimation of the percentage of Na+, K+-ATPase α-subunits immunoprecipitated with antiphosphotyrosine antibodies under control or stimulated conditions. Proximal tubules were preincubated for 30 min at 37°C without or with stimulators. Extracts were prepared and aliquots were subjected to immunoblotting with the McK1 antibody before (b) or after (a) immunoprecipitation with the PY20 antibody. (A) Tyrosine phosphorylation of the α-subunit from control or insulin-treated (10−8 M) tubules. Upper panels, immunoblots. Lower panel, quantification of data shown in upper panels and expressed as percent of the total α-subunit population immunoprecipitated with the PY20 antibody. Results are means ± SEM from four independent experiments. (B) Tyrosine phosphorylation of the α-subunit from control or orthovanadate-treated (10−3 M) tubules. Upper panels, immunoblots. Lower panel, quantification of data shown in upper panels and expressed as percent of α-subunits of the total α-subunit population immunoprecipitated with the PY20 antibody (*, p < 0.05 vs. control).

